Lesson Introduction
-
Video Lesson
- IELTS Academic Writing Task 1 Lesson 4 - Pie charts
章节 1
Hello! Welcome to lesson 4 in our IELTS Academic Writing Task 1 series. In this lesson, we are going to learn how to analyze and write about pie charts.
First of all, IELTS Academic Writing Task 1 uses the same structure for all visuals — whether it’s a pie chart, line graph, table, bar chart, or a combination of multiple charts. The structure is as follows:
- Introduction: Paraphrase the question
- Overview: Describe the overall trend or main groupings
- Body paragraph 1: Write in detail about the first grouping logically
- Body paragraph 2: Write in detail about the second grouping logically
The steps to write the report for this task are simple:
- Analyze the chart(s) and plan how to group the information
- Write an essay using the recommended structure
- Proofread your essay
One important point to remember is that you must write facts and compare data — no opinions or conclusions are required in Task 1.
It is also important to understand how the task is marked, so you can give the examiner what they need for a higher band score. Writing Task 1 is assessed on four criteria:
- Task Achievement (accurately describing the information presented)
- Coherence and Cohesion (clarity and logical organization; grouping data effectively supports coherence)
- Grammatical Range and Accuracy (using correct grammar to describe trends, figures, and comparisons)
- Lexical Resource (using clear, accurate, and relevant vocabulary with good paraphrasing skills)
Okay! Now let’s look at pie charts specifically.
In IELTS Writing Task 1 pie chart questions, you may see two pie charts or one pie chart. If there are two pie charts, you will need to compare them in your writing. If there is only one, you must describe the information you observe. Since the strategies differ, it’s important to be prepared for both types of questions.
In this lesson, you will learn how to handle both situations and analyze two high-scoring model essays. If you want to practice more pie chart questions, visit our “IELTS QUESTIONS” section.
Now let’s get started! We’ll first look at an example question featuring one pie chart.
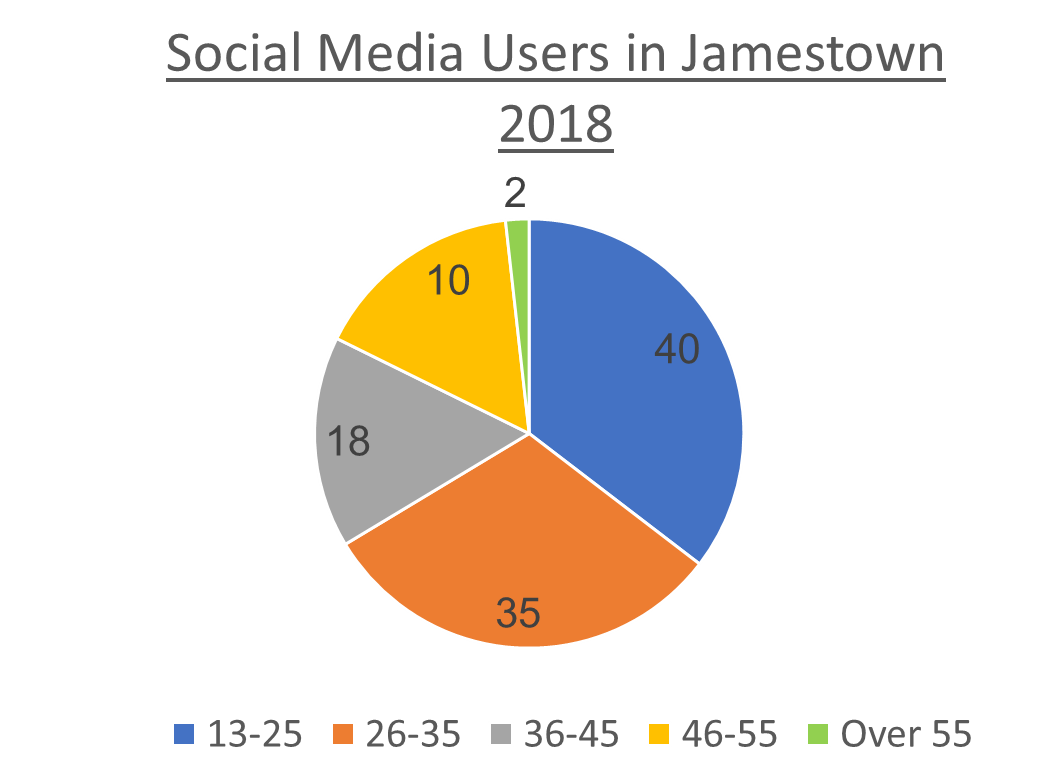
The chart below shows the percentage of social media users by age in Jamestown in 2018. Summarize the information by selecting and reporting the main features. Write at least 150 words.
Step 1: Analyze the chart(s) and plan how to group the information
A single pie chart question is usually straightforward and easy to group. Look at each segment and note what percentage it represents. You’ll see one segment that is the largest and another that is the smallest — these are good starting points, as shown in the table below.
| First grouping: Age groups that used social media more | Age 13–25: 45% Age 26–35: 35% |
| Second grouping: Age groups that used social media less | Over 55: 2% Age 46–55: 10% Age 36–45: 18% |
From this, we can see the general trend that the older a person was in Jamestown in 2018, the less likely they were to use social media. Including this observation in your essay helps summarize what the chart truly represents.
Step 2: Write an essay using the recommended structure
Now that you’ve analyzed the task and grouped the data, it’s time to write your essay. We recommend pausing here to write your own version using the language from earlier lessons. Then, return to review the model essay and analysis.
Model Essay
The chart below shows the percentage of social media users by age in Jamestown in 2018. Summarize the information by selecting and reporting the main features. Write at least 150 words.
Important functional words are highlighted in red
Useful vocabulary and phrases are highlighted in green
Synonyms and topic vocabulary are highlighted in blue
Introduction
The given pie chart illustrates the proportion of people using digital networking by age group in Jamestown in 2018.
Overview
Overall, the general trend was that older people were less likely to use digital networking in Jamestown during 2018.
‘The’ + comparative adjective + ... + ‘the more/less likely they were’ + infinitive verb.
Body Paragraph 1
In terms of the most significant feature of the chart, the largest group of digital communicators was aged 13 to 25, which accounted for 40% of total users. The next major group was those aged 26 to 35, contributing slightly less at 35%. Combined, these two age groups made up 75% of all social media users in Jamestown.
Body Paragraph 2
In stark contrast, the group aged over 55 comprised only 2% of users. People aged 46 to 55 contributed 10%, and those between 36 and 45 made up 18%.
章节 2
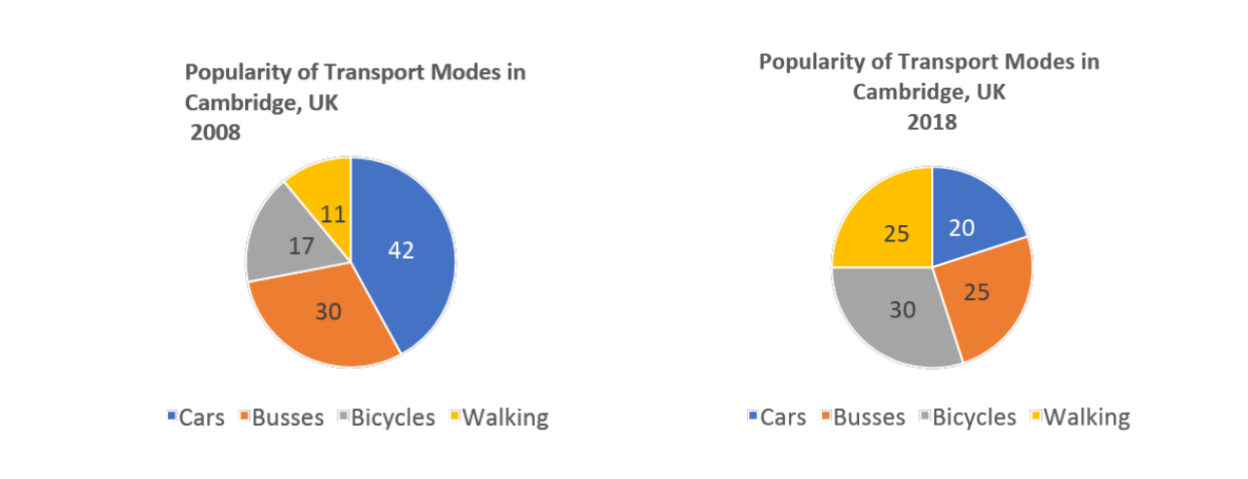
The charts below provide information on popular modes of transport in the city of Cambridge for the years 2008 and 2018. Summarize the information by selecting and reporting the main features, and make comparisons where relevant. Write at least 150 words.
Step 1: Analyze the charts and plan how to group the information
Here is a top tip for you. One of the most common mistakes that people make when they write about two pie charts is that they don’t compare and contrast them. They describe each pie chart in a separate paragraph, which can cause them to lose marks. The examiner gives you two pie charts on purpose—to test your ability to analyze how they relate to each other. Therefore, you must compare and contrast the two charts in your report.
Here’s one way to group and compare the information effectively:
The first grouping:
Choose 2–3 segments that account for higher percentages in the first pie chart, and then describe how these segments change from the first to the second chart.
The second grouping:
Choose 2–3 segments that account for lower percentages in the first pie chart, and then describe how these segments change between the two charts.
| The first grouping | Cars → decreased from 42% to 20% Buses → decreased from 30% to 25% |
| The second grouping | Bicycles → increased from 17% to 30% Walking → increased from 11% to 25% |
Next, figure out if there are any general trends when comparing the two pie charts.
You can see that walking and cycling became more popular while cars and buses became less popular between 2008 and 2018.
Some students might add the following in their essay:
This trend can be explained by the increased focus on the environment in cities. People no longer want to use transport that causes pollution, so instead they choose to walk or cycle.
DO NOT DO THIS!
You don’t need to give reasons for the trend. You just need to correctly describe the trend based on the chart information.
Step 2: Write an essay using the recommended structure
Now that you’ve analyzed the task and grouped the data, it’s time to write your essay. We recommend that you pause here and try writing your own essay using the language and structure covered in previous lessons. Then, return to this lesson to review the model essay and analysis below.
Model Essay
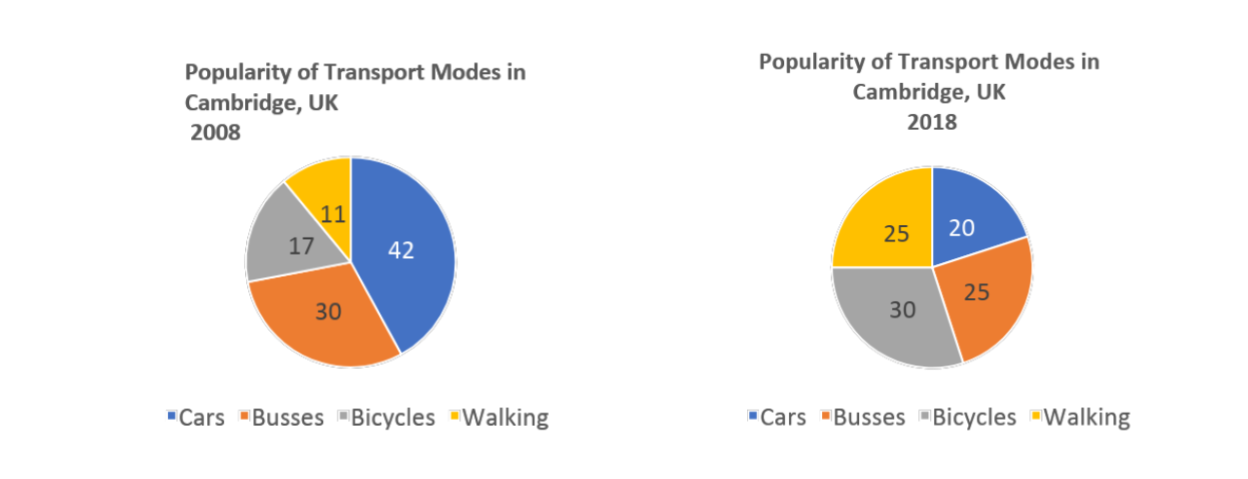
The charts below provide information on popular modes of transport in the city of Cambridge for the years 2008 and 2018. Summarize the information by selecting and reporting the main features and make comparisons where relevant. Write at least 150 words.
Important functional words are highlighted in red
Useful vocabulary and phrases are highlighted in green
Synonyms and topic vocabulary are highlighted in blue
Introduction
The pie charts compare the popularity of various modes of transportation used in Cambridge in 2008 and 2018.
Overview
Overall, after a decade, the general trend was that Cambridge’s population had moved away from using motorised vehicles in favor of human-powered transport by 2018.
The second paragraph describes the overall trend.
The past perfect tense is used to show how things had changed:
Structure: subject + had + past participle + by + year
Example: Cambridge’s population had moved away from using motorised vehicles, preferred by the majority in 2008, in favor of human propulsion by 2018.
Body Paragraph 1
In terms of vehicle transport, in 2008, cars were the most popular choice, preferred by 42% of people. This was followed by bus usage at 30%. Moreover, 72% of people used either of these forms of transportation. In contrast, over the next decade personal motor vehicle use declined significantly, and by 2018, it was the least popular transport form. On the other hand, bus usage dropped slightly by 5%.
This paragraph compares the popularity of car and bus travel in 2008 and 2018.
“In contrast” is used to highlight the difference between the two years.
Body Paragraph 2
However, human propulsion, represented by cycling and walking, was unpopular in 2008. Bicycles were chosen by only 17% of people, and walking was the least popular choice at 11%. Nevertheless, by 2018, cycling and walking combined experienced a 27% increase in popularity — their use nearly doubled.
This paragraph compares the popularity of cycling and walking between 2008 and 2018.
“Nevertheless” is used to contrast what happened in the two years.
You've completed the lesson: IELTS Academic Writing Task 1 Lesson 4 - Pie charts
What would you like to do next?
Select a different lesson.