Lesson Introduction
-
Video Lesson
- IELTS Academic Writing Task 1 Lesson 5 - Line graphs
章节 1
Hello! Welcome to lesson 5 in our IELTS Academic Writing Task 1 series. In this lesson, we are going to look at how to analyze and write about line graphs. Afterward, if you want to practice more line-graph questions, you can find them in our “IELTS QUESTIONS” section.
In a line graph, there are usually multiple lines that show changes over time. In your writing, you need to group information based on lines that have similar trends or values, so your essay structure will be as follows:
- Introduction: Paraphrase the question
- Overview: Describe the overall trend or give a general overview of the main groupings
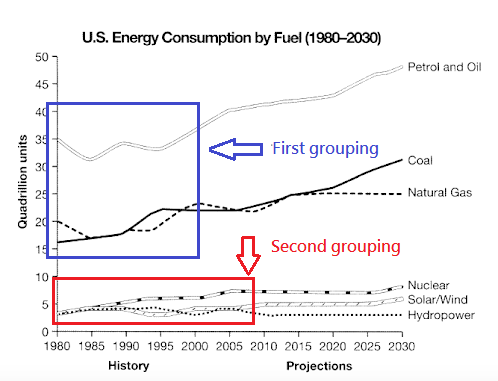
- Body paragraph 1: Describe the first grouping of lines that have similar trends or values.
- Body paragraph 2: Describe the second grouping of lines that have similar trends or values.
You also need to pay attention to time. There could be a date range from the past with predictions for the future. In that case, it is important to use the past tense and the future tense where necessary.
Step 1: Analyze the graph and plan how to group the information
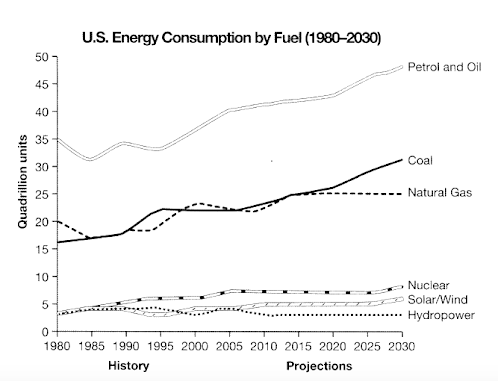
Okay! As you can see from the line graph below, the fossil fuels (coal, gas, oil) show the highest consumption of units with predicted increases, while cleaner energy (wind, hydro, solar, nuclear) has the lowest consumption of units and will remain relatively low. So the best way to group the data is into two categories (fossil fuels and cleaner energy).
Step 2: Write an essay using the recommended essay structure
Now that you’ve analyzed the task and figured out how to group the information, let’s write the essay. We recommend you stop here and actually write an essay using the language we’ve taught in previous lessons! Come back to this lesson to check the model essay and analysis.
Model Essay
Important functional words are highlighted in red
Useful vocabulary and phrases are highlighted in green
Synonyms and topic vocabulary are highlighted in blue
Introduction
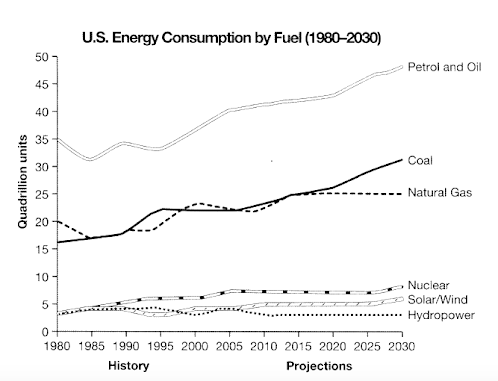
The given line graph illustrates data from a 2008 report on energy consumption in the USA since 1980, with projections to 2030.
Overview
Overall, fossil fuels have shown increases in consumption since the start of the period, with expectations of even greater reliance on these fuel sources. Cleaner energy sources have accounted for considerably less consumption, with predictions for a similar trend.
Body paragraph 1
Regarding fossil fuels such as coal, natural gas, petrol, and oil, they have seen steady increases in energy consumption since 1980. Petrol and oil started at 35 quadrillion units in 1980, then fluctuated until 2000, at which point they rose steadily with a prediction of over 45 quadrillion units by 2030. Additionally, coal followed a similar rising trend. It is predicted that it will have surpassed 30 quadrillion units by 2030. Natural gas usage demonstrated fluctuations and it is set to level off at around 24 quadrillion units from 2020 onwards.
“Level off” means a value stops rising and remains the same.
“Future perfect” and “the passive” are used to describe the future trends here:
- It is predicted that it will have surpassed 30 quadrillion units by 2030.
- Natural gas usage demonstrated fluctuations and it is set to level off at around 24 quadrillion units from 2020 onwards.
Body paragraph 2
In contrast, cleaner energy sources all began the period at under 5 quadrillion units and showed declines in their use, with the exception of nuclear, which climbed slightly to 6 quadrillion units in 2005, with solar/wind expected to see slight increases. Hydropower is projected to remain relatively unchanged until 2030.
章节 2
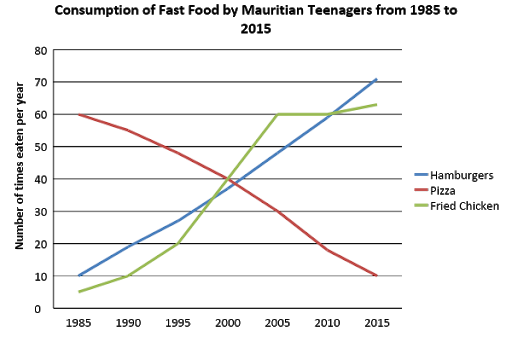
It is evident that the consumption of hamburgers and fried chicken shows an upward trend, whereas pizza consumption displays a downward trend. Therefore, the best way to group the data would be as follows:
| First grouping | Hamburger consumption and fried chicken consumption |
| Second grouping | Pizza consumption |
Write your essay on paper. To view the model essay, go to the next section.
Model Essay
Important functional words are highlighted in red
Useful vocabulary and phrases are highlighted in green
Synonyms and topic vocabulary are highlighted in blue
Introduction
The line graph depicts the consumption of three types of fast food — hamburgers, pizza, and fried chicken — over a 30-year period among Mauritian teenagers. Units are given as the number of times each food was eaten per year.
Overview
Overall, hamburgers and fried chicken became the most popular foods by 2015, showing the largest increases in consumption, while pizza, initially the most widely eaten, declined sharply in popularity.
Body Paragraph 1
With regard to hamburgers, consumption showed a steady upward trajectory from 10 times per year to over 70 times. Similarly, teenagers in Mauritius ate fried chicken only 5 times per year in 1985 before it rose dramatically and then leveled off in 2005, followed by a slight increase towards the end of the period, finishing as the second most popular food.
Body Paragraph 2
In contrast, although pizza was the most popular food among Mauritian adolescents in 1985, its consumption fell steadily from 60 times per year to just 10 by the final year.
You've completed the lesson: IELTS Academic Writing Task 1 Lesson 5 - Line graphs
What would you like to do next?
Select a different lesson.