Lesson Introduction
-
Video Lesson
- IELTS Academic Writing Task 1 Lesson 10 - Bar charts Part 3
Teil 1
Hello! Welcome to lesson 10 in our IELTS Academic Writing Task 1 series. In this lesson, we are going to look at how to analyse and write about questions that include two bar charts.
The essay structure for two-bar-chart questions is as follows:
- Introduction: Paraphrase the question
- Overview: Summarise the overall trends across the two bar charts
- Body paragraph 1: Write about the significant features of the first bar chart
- Body paragraph 2: Write about the significant features of the second bar chart
The key to tackling two bar charts is to think about how the two charts are connected. The examiner has given them together to see whether you can link the information.
Let’s look at an example.
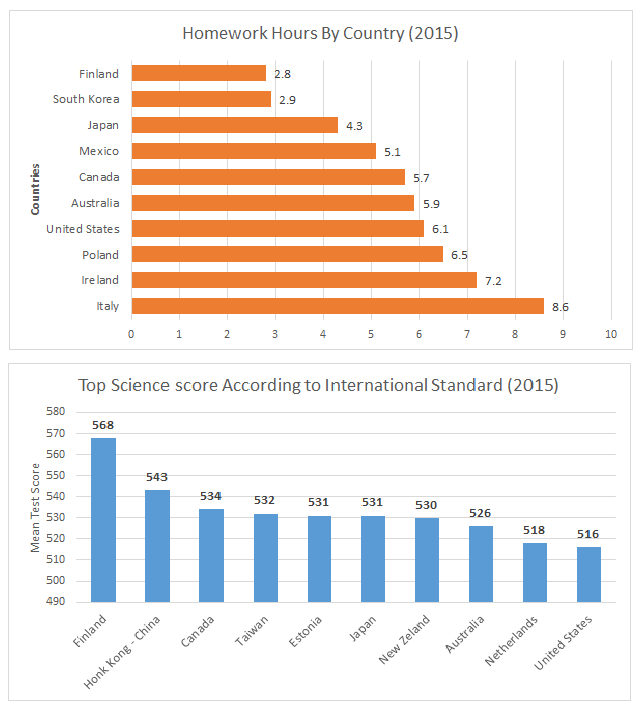
The bar charts show education data related to 15-year-olds in 10 different countries in 2015. The first chart shows the countries where adolescents do the most homework (hours per week). The second chart shows the nations that scored best on an international science test. Summarise the data by selecting and reporting the main features, and make comparisons where relevant. Write at least 150 words.
Step 1: Analyse the chart and plan how to group the information
Here you are given two charts, so you will describe the first bar chart in Body Paragraph 1 and the second bar chart in Body Paragraph 2.
For the overview paragraph, summarise the general trends across both charts and consider whether there is a correlation between the two bar charts.
There appears to be a correlation between countries where students spend little time on homework and higher science scores.
Step 2: Write an essay using the recommended essay structure
Now that you’ve analysed the task and decided how to group the information, write the essay. We recommend you pause here and write your own response using language from previous lessons. Then return to check the model essay and analysis.
Model Essay
The bar charts show education data related to 15-year-olds in 10 different countries in 2015. The first chart shows the countries where adolescents do the most homework (hours per week). The second chart shows the nations that scored best on an international science test. Summarise the data by selecting and reporting the main features, and make comparisons where relevant. Write at least 150 words.
Important functional words are highlighted in red
Useful vocabulary and phrases are highlighted in green
Synonyms and topic vocabulary are highlighted in blue
Introduction
The first bar chart illustrates the number of hours spent by 15-year-old adolescents on homework in various countries in 2015. The second chart highlights the top countries for science scores among the same age group in 2015, measured against an international standard.
Overview
Overall, there appears to be a correlation between countries where students spend less time doing homework and higher science scores.
Body paragraph 1
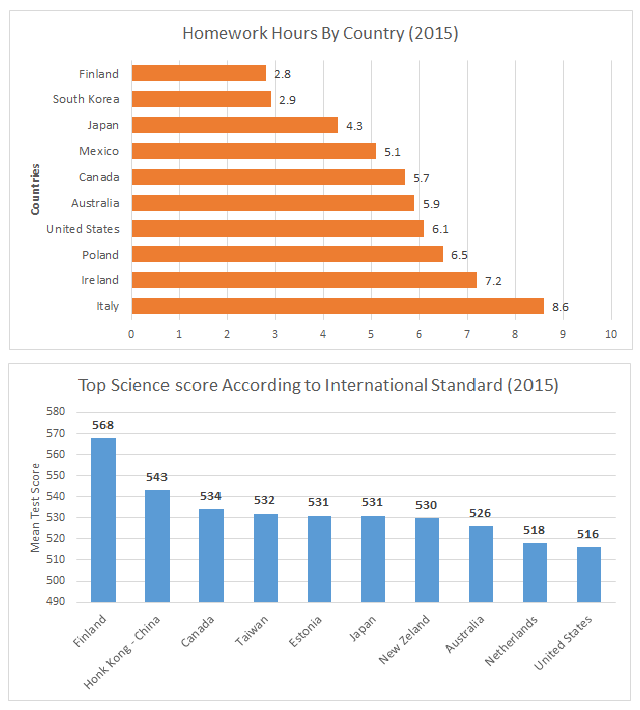
Of the countries with the least time spent doing homework, Finland recorded the lowest figure (2.8 hours), while South Korean and Japanese students averaged 2.9 and 4.3 hours, respectively. In contrast, students in most other countries averaged between five and seven hours, and those in Italy spent the longest time (8.6 hours), over four times longer than students in Finland.
Body paragraph 2
With respect to science scores, teenagers in Finland clearly achieved the highest mean score (568), despite spending the least time doing homework. Aside from Hong Kong (China) with 543, adolescents in the next six nations scored around 530 points. The lowest scores were recorded by the Netherlands and the United States. Interestingly, Italy did not place within the top ten.
You've completed the lesson: IELTS Academic Writing Task 1 Lesson 10 - Bar charts Part 3
What would you like to do next?
Select a different lesson.