Lesson Introduction
-
Video Lesson
- IELTS Academic Writing Task 1 Lesson 8 - Bar charts Part 1
Teil 1
Hello! Welcome to lesson 8 in our IELTS Academic Writing Task 1 series. In this lesson, we are going to look at how to analyse and write about bar charts.
Bar charts are common in IELTS Writing Task 1 (Academic). There are three different scenarios you may encounter:
- A bar chart with categories on the x-axis
- A bar chart with dates or years on the x-axis (acts like a line graph)
- Two bar charts presented together
Each scenario requires a slightly different approach. This lesson covers the first scenario: a bar chart with categories on the x-axis.
Let’s start with our first bar chart question!
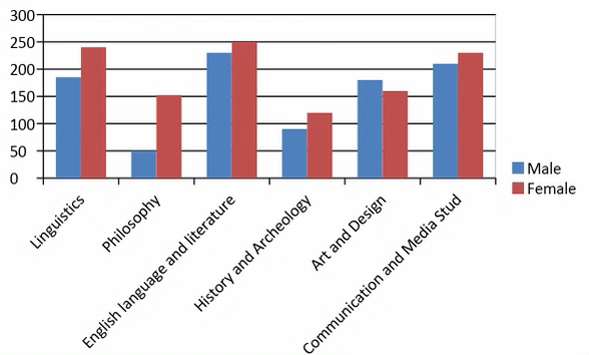
The chart below shows the proportion of male and female students studying six art-related subjects at a UK university in 2011. Summarise the information by selecting and reporting the main features, and make comparisons where relevant. Write at least 150 words.
Step 1: Analyse the chart and plan how to group the information
First, organise the information into two groups. For this task, it’s straightforward: male and female. Next, identify information that stands out—you can’t write about every single data point.
To find what stands out, look for high and low values. Here is how to group the data for two body paragraphs.
|
First grouping (Body paragraph 1) |
Male enrolment: Language-based subjects
|
|
Second grouping (Body paragraph 2) |
Female enrolment: Language-based subjects
|
The next step is to determine the overall trend. The following two checks help:
- Check if there is one category that is significantly higher or lower overall.
- Which subjects show large differences vs. small differences between genders?
Let’s apply this strategy to this task:
|
1. Check if there is one category that is significantly higher or lower overall. More males: Art and Design More females: all subjects except Art and Design → Clear trend for the overview paragraph. 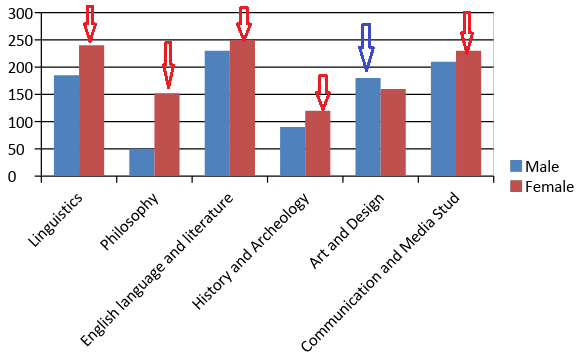
|
|
2. Large vs. small differences Five of the six subjects have relatively similar enrolment numbers by gender. Only one subject shows a large gender gap (Philosophy). → Include this in the overview paragraph. 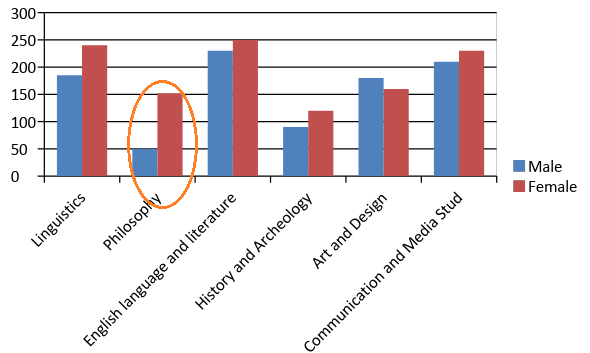
|
Step 2: Write an essay using the recommended essay structure
Now that you’ve analysed and grouped the information, write your essay using the language taught in previous lessons. Then return here to check the model essay and analysis.
Model Essay
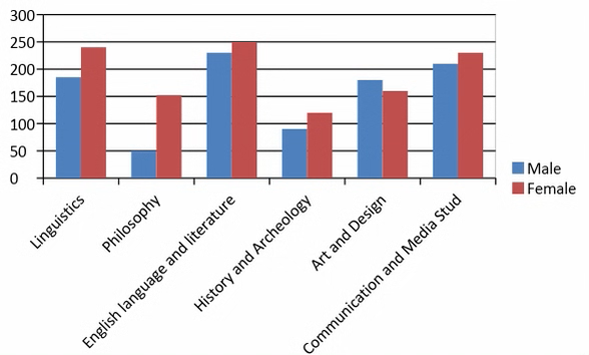
The chart below shows the proportion of male and female students studying six art-related subjects at a UK university in 2011. Summarise the information by selecting and reporting the main features, and make comparisons where relevant. Write at least 150 words.
Important functional words are highlighted in red
Useful vocabulary and phrases are highlighted in green
Synonyms and topic vocabulary are highlighted in blue
Introduction
The bar chart shows the distribution of students by gender across six art-based disciplines at a UK university in 2011.
Overview
Generally speaking, females outnumber males in most disciplines, and the gender gap is modest in five subjects. Notably, Philosophy shows a pronounced gap, with female students outnumbering males by almost three to one.
Body paragraph 1
Regarding male enrolment, Art and Design was the only subject with more men than women at a ratio of 120 to 90. Among language-based subjects—Linguistics, English Language and Literature, and Communication and Media—enrolments were comparatively strong. The least popular subject for males was Philosophy, with only 50 students enrolled.
Body paragraph 2
Looking specifically at female enrolment, a higher proportion of women than men enrolled in five of the six subjects. Like men, women were also drawn to language-based subjects; of these, English Language and Literature was the most popular with an enrolment of 250 students. With regard to the least popular subject for females, History and Archaeology had about 120 students.
Teil 2
As you’ve learned in previous lessons, it is important to group information into two groups. Next, you’ll learn different strategies for grouping information based on the type of bar chart.
First up is the same as the previous example, except we’ll be working with percentages instead of numbers. Let’s look at the example now.
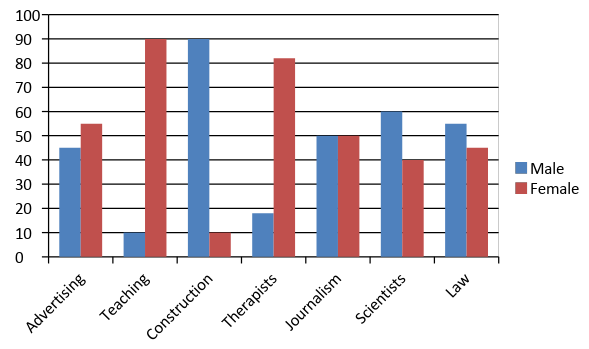
The chart illustrates the percentage of male and female executives in six different types of profession across the UK in 2007. Summarize the information by selecting and reporting the main features, and make comparisons where necessary. Write at least 150 words.
Step 1: Analyze the chart and plan how to group the information
In this step, the first thing you need to do is to organize the information into two groups. Here is how you can group the data into two body paragraphs:
| First grouping (Body paragraph 1) |
Male-dominated fields: Construction: 90% Scientists: 60% Therapists: less than 20% |
| Second grouping (Body paragraph 2) |
Female-dominated fields: Teaching: 90% Therapists: 80% Construction: 10% |
The next thing you need to do is to find out the overall trend.
| 1. Check if there is one category that is significantly higher or lower overall.
More female: 3 (Advertising, Teaching, Therapists) More male: 3 (Construction, Scientists, Law) Equal number of male and female jobs: Journalism => No clear trend can be found from this step 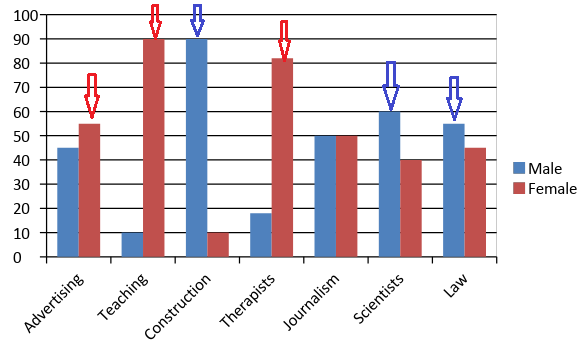
|
| 2. Find those with huge value differences and those with little differences.
Four out of seven fields have a relatively equal number of male and female jobs. Three out of seven fields have large gender gaps (Construction, Teaching, Therapists). => This is a clear trend you can include in your overview paragraph. 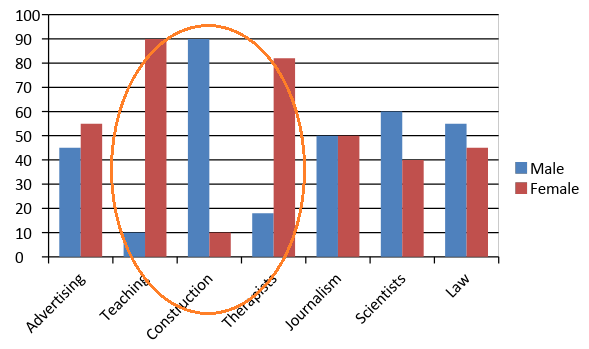
|
Step 2: Write an essay using the recommended essay structure
Take a look at our model essay below.
Model Essay
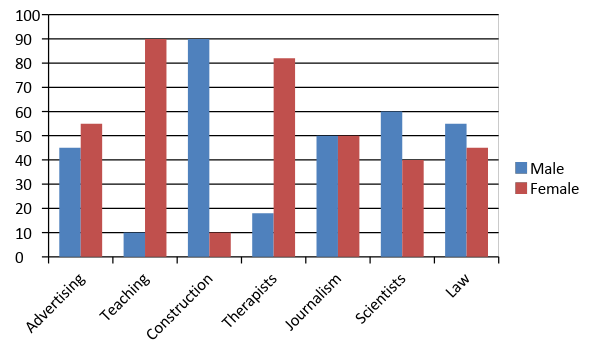
The chart illustrates the percentage of male and female executives in six different types of profession across the UK in 2007. Summarize the information by selecting and reporting the main features, and make comparisons where necessary. Write at least 150 words.
Important functional words are highlighted in red
Useful vocabulary and phrases are highlighted in green
Synonyms and topic vocabulary are highlighted in blue
The chart compares the percentage of male and female professionals in seven very different career settings, from advertising to law, in 2007.
Overall, in roughly half of the occupations listed, both genders were approximately equally represented. However, in traditionally gender-dominated professions such as teaching, construction, and therapy, gender gaps still exist.
From the outset, there were far more men than women in the traditionally male-dominated fields of construction and science, with men making up 90 percent and 60 percent of jobs respectively. By contrast, only one in ten men held positions in teaching. The only field with men holding exactly the same number of positions as women was journalism.
Looking specifically at female-dominated fields, women held more jobs in the traditionally female-dominated areas of teaching and therapy. Women dominated the former, accounting for 90% of positions, and therapy was similar, with women holding 82% of all jobs as opposed to 18% for men. In contrast, women held only 10% of jobs in the male-dominated construction field.
Teil 3
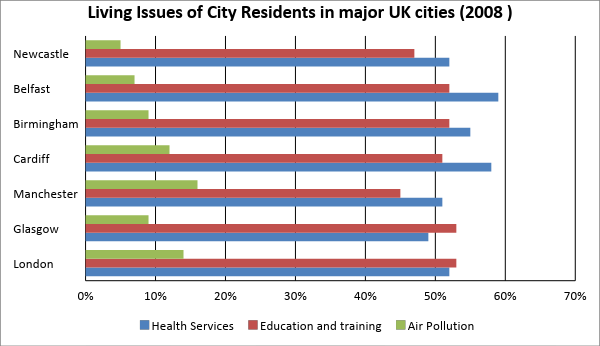
The chart below presents some of the most commonly reported issues among people living in UK cities in 2008 (%). Summarise the information by selecting and reporting the main features, and make comparisons where relevant. Write at least 150 words.
Step 1: Analyse the chart and plan how to group the information
The first thing you need to do is organize the information into two groups. It is clear that Health Services and Education and Training account for a much higher proportion of living issues than Air Pollution. Therefore, you can group Health Services and Education and Training together, and Air Pollution separately.
| First grouping (Body paragraph 1) |
Write about Health Services and Education and Training |
| Second grouping (Body paragraph 2) |
Write about Air Pollution |
The next step is to identify the overall trends.
|
1. Check if there is one category that is significantly higher or lower overall. Health Services accounted for the highest percentage in five cities. Education and Training accounted for the highest percentage in two cities. In all cities, Air Pollution represented a much smaller percentage of living issues compared to other categories. => This is a clear trend that should be mentioned in your overview paragraph. |
|
2. Identify categories with large or small value differences. In every city, Health Services and Education and Training were close. => This is another clear trend to include in your overview paragraph. |
Step 2: Write an essay using the recommended structure
Now, take a look at the model essay below.
Model Essay
The chart below presents some of the most commonly reported issues among people living in UK cities in 2008 (%). Summarise the information by selecting and reporting the main features, and make comparisons where relevant. Write at least 150 words.
Important functional words are highlighted in red
Useful vocabulary and phrases are highlighted in green
Synonyms and topic vocabulary are highlighted in blue
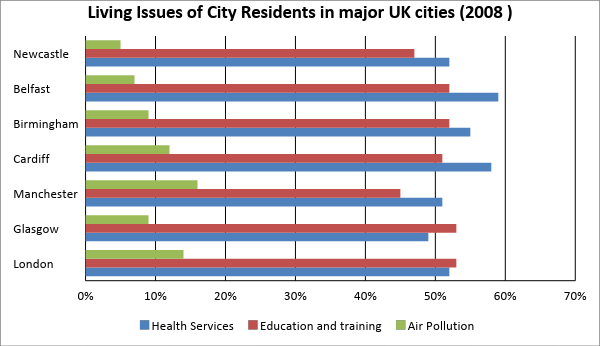
The chart illustrates key living issues reported by residents of seven major UK cities (Newcastle, Belfast, Birmingham, Cardiff, Manchester, Glasgow, and London) in 2008. Units are expressed as percentages.
Overall, health services were the most significant living issue in most cities, followed closely by education and training. Air pollution was the least concerning issue across the UK, averaging roughly five times less significant than other problems for urban populations.
Regarding health services, in five of the seven cities, over half of the residents identified it as their top concern. This was particularly true in Belfast and Cardiff, where almost 60% of inhabitants cited it as their main issue. Education and training ranked a close second across all city populations, showing less than a 10% difference from health services — except in Glasgow (53%) and London (52%), where it became the most serious problem.
With regard to air pollution, only Manchester (16%), London (14%), and Cardiff (12%) recorded figures above ten percent. The least concerned city was Newcastle, where only 5% of residents considered air pollution an issue.
You've completed the lesson: IELTS Academic Writing Task 1 Lesson 8 - Bar charts Part 1
What would you like to do next?
Select a different lesson.