Lesson Introduction
-
Video Lesson
- IELTS Academic Writing Test Introduction
भाग 1
In this lesson, we'll go over an overview of IELTS Writing Academic Task 1.
Let’s get started!
Writing Task 1
Writing Task 1 involves a graph, table, chart, or diagram. Test takers are required to describe, summarize, or explain the information presented in their own words. This task can involve analyzing and explaining data, detailing the specific stages of a given process, or describing how something works.
Let’s take a look at some common ways that data are presented in these questions, along with sample images and questions.
| Visual Data | Sample Question |
|---|---|
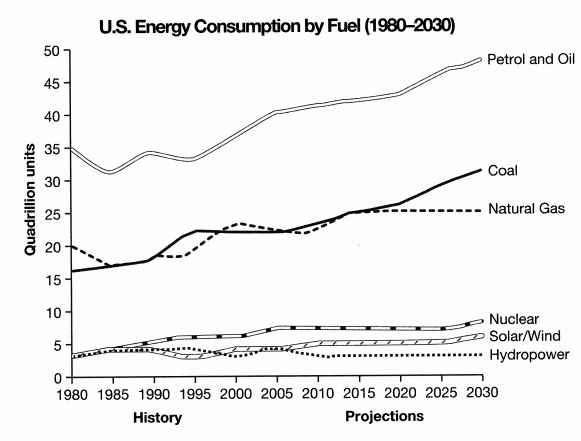
Line Graphs |
The graph gives information from a 2008 report about consumption of energy in the USA since 1980 with projections until 2030. Summarise the information by selecting and reporting the main features, and make comparisons where relevant. Write at least 150 words. |
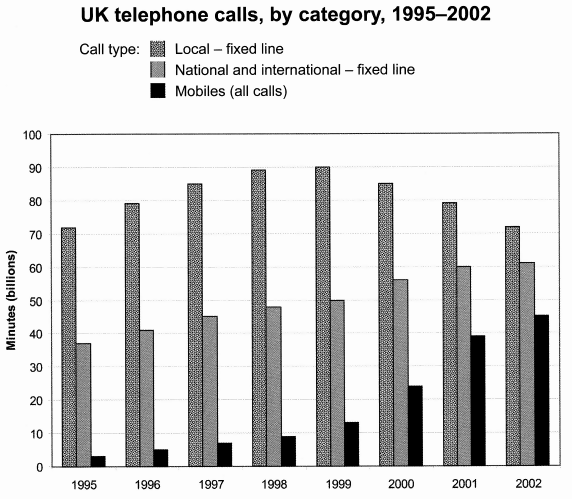
Bar Charts |
The chart shows the total number of minutes (in billions) of telephone calls in the UK, divided into three categories, from 1995–2002. Summarise the information by selecting and reporting the main features, and make comparisons where relevant. Write at least 150 words. |
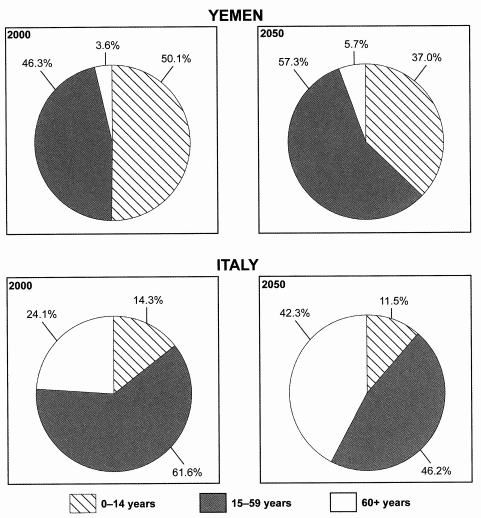
Pie Charts |
The charts give information on the ages of the populations of Yemen and Italy in 2000 and projections for 2050. Summarise the information by selecting and reporting the main features, and make comparisons where relevant. Write at least 150 words. |
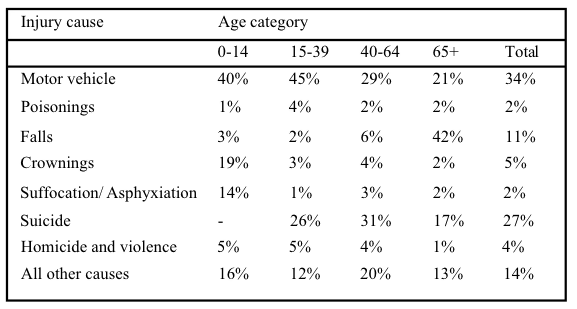
Tables |
The table shows the causes of injury by age and their percentage contribution to total deaths during a 12-month period in Australia. Describe the information in the table. Write at least 150 words. |
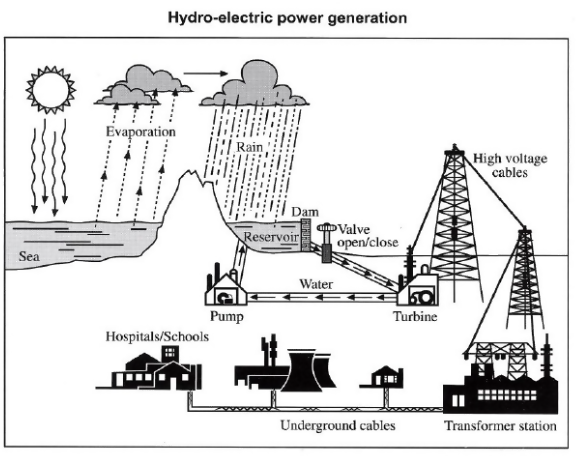
Diagrams |
The diagram below shows the process of using water to produce electricity. Summarise the information by selecting and reporting the main features, and make comparisons where relevant. |
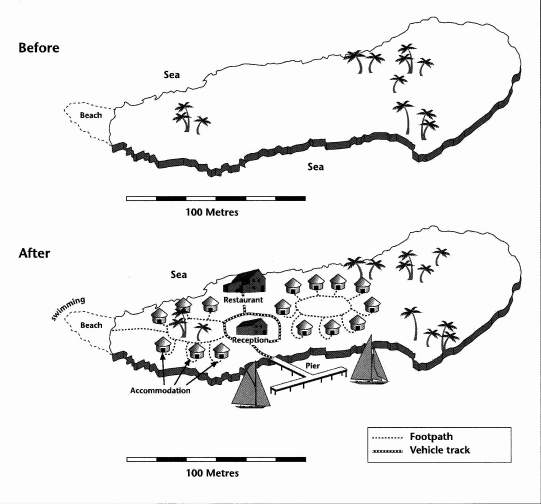
Maps |
The two maps show an island before and after the construction of tourist facilities. Summarise the information by selecting and reporting the main features, and make comparisons where relevant. Write at least 150 words. |
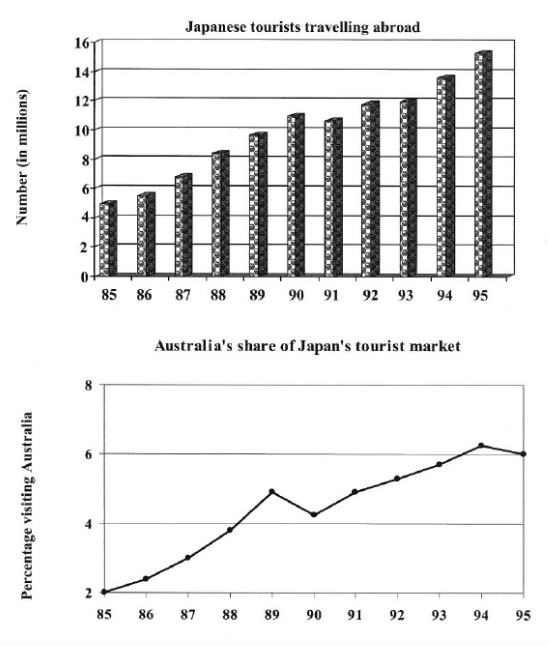
Mixed Graphs |
The charts show the number of Japanese tourists travelling abroad between 1985 and 1995 and Australia’s share of the Japanese tourist market. Summarise the information by selecting and reporting the main features, and make comparisons where relevant. Write at least 150 words. |
As stated in the practice questions, test takers will need to write at least 150 words for this portion of the test, and it is best to allot 20 minutes for this section of the writing exam.
While each question type requires a different structure and procedure, it’s best to keep these general “Do’s” and “Don’ts” in mind when answering Writing Task 1 questions:
What To Do:
1. DO read the question carefully and understand how you want to answer it. Be sure to understand whether you need to compare, contrast, describe, or summarise.
2. DO take the time to plan out your outline and notes. Taking at least one minute to outline your essay will greatly improve your score. Each question type will require a slightly different outline, which will be explored later.
3. DO start writing as soon as you are sure of your outline. Remember, you should only spend about 20 minutes on this task.
In General:
DO use the passive voice where possible, since the questions never feature specific people or names. For example: “The percentage of market share increased by 15% from 1990 to 1992,” not “People increased the market share by 15% from 1990 to 1992.”
DO use proper and formal language.
DO make one single line through mistakes and write the correct word beside it. For example: bacround background.
What Not To Do:
DON’T start writing immediately without an outline.
DON’T write too much or too little—stay around 150 words.
DON’T write long introductions or conclusions; focus on analysis.
DON’T use informal language or make careless errors.
You've completed the lesson: IELTS Academic Writing Test Introduction
What would you like to do next?
Select a different lesson.