Lesson Introduction
-
Video Lesson
- IELTS Academic Writing Task 1 Lesson 14 - More Than Two Pie Charts
Part 1
Hello! In this lesson we are going to examine the best way to analyze and write about questions that include more than two pie charts.
The essay structure for questions with more than two pie charts is as follows:
- Introduction: Paraphrase the task question
- Overview: Summarize the overall trend of the pie charts
- Body Paragraph 1: Write about the first significant feature
- Body Paragraph 2: Write about the second significant feature
It’s important to notice that it is not always efficient to write about each and every pie chart separately, because that would take far too long. Remember, you must reach the minimum of 150 words, but you don’t want to go overboard. These tasks usually require more writing since there is more to analyze, so keep things concise.
In this case, writing about features (such as years or other groupings) and how the pie charts fit into these features is the best strategy to include all the necessary information.
Let’s look at an example!
Step 1: Analyze the pie charts and plan how to group the information.
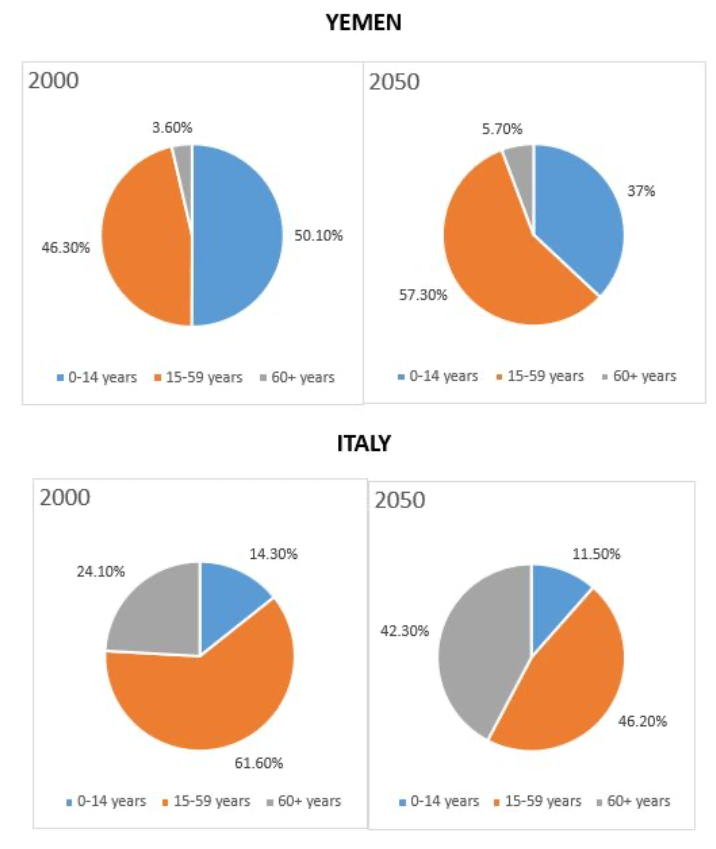
In this example, you are given four pie charts. Two correspond to population data in Yemen, and two correspond to population data in Italy. Remember: you should not write about each pie chart separately. How else can we combine this information?
Look at the features in the charts. The two years—2000 and 2050—are the key features. We will describe and compare Italy and Yemen’s population data for 2000, and then for 2050. This lets us compare countries within each year and compare years within each country, concisely.
Dedicating one paragraph to Italy and one to Yemen seems logical, but it forces you to describe both years in each paragraph and cross-compare countries and years—too much writing. Grouping by year is clearer and more concise.
Taking notes in the form of a table will help you organize your thoughts:
Body Paragraph 1: |
Yemen → About half of the population in 0–14 group / Senior citizens less than 5% / 15–59 group slightly under half of the population Italy → 14% in 0–14 group / Senior citizens about a quarter / Largest group 15–59 years old |
Body Paragraph 2: |
Yemen → 0–14 expected to decline to 37% / Senior citizens increase by ~2% / 15–59 group will grow Italy → 0–14 expected to drop by ~3% / Senior citizens will almost double / 15–59 group reduced substantially |
Now, find the overall trend. Two helpful steps:
1. Check if one category is higher or lower overall.
2. Find trends with large or small differences.
Both countries change in the share of age groups. The 60+ group increases from 2000 to 2050 in both Yemen and Italy, while the 0–14 group decreases in both—two clear trends for your overview.
Step 2: Write an essay using the recommended structure.Using the notes from Step 1, follow this format:
Body Paragraph 1: |
Yemen → About half in 0–14 / Seniors <5% / 15–59 slightly under half Italy → 14% in 0–14 / Seniors ≈25% / 15–59 largest (~just over 60%) |
Body Paragraph 2: |
Yemen → 0–14 to 37% / Seniors +~2% / 15–59 grows Italy → 0–14 −~3% / Seniors almost double / 15–59 decreases markedly |
Now, it’s time to state the overall trend clearly, then write the paragraphs.
IntroductionThe pie charts represent population data based on age in Yemen and Italy in 2000, along with future predictions for 2050.
Overview
Overall, changes in proportions of age groups are expected in both countries, including an increase in the percentage of people over 60 years old and a decrease in those aged 0 to 14 by 2050.
Body Paragraph 1
In 2000, the 0–14 age group constituted roughly half of Yemen’s total population, while only 14 percent of Italian citizens were in this category. Senior citizens made up less than five percent of Yemen’s total, in contrast to approximately a quarter of Italy’s population. People aged 15–59 represented Italy’s largest group at just over 60 percent, whereas this group was slightly under half of Yemen’s inhabitants.
Body Paragraph 2
In 2050, it is predicted that the share aged 0–14 will decline to 37 percent in Yemen, compared to a small (≈3%) drop in Italy. While senior citizens are expected to almost double in Italy, they are likely to increase by about two percent in Yemen. Although the 15–59 group is expected to grow in Yemen, it will be reduced substantially in Italy.
Word Count: 213
Important functional words are highlighted in red
Useful vocabulary and phrases are highlighted in green
Synonyms and topic vocabulary are highlighted in blue
Part 2
In this next example, we will be presented with six pie charts representing different regions of the world. Although there are more charts in this case, the same strategy from the first example can still be applied effectively!
Step 1: Analyze the pie charts and plan how to group the information
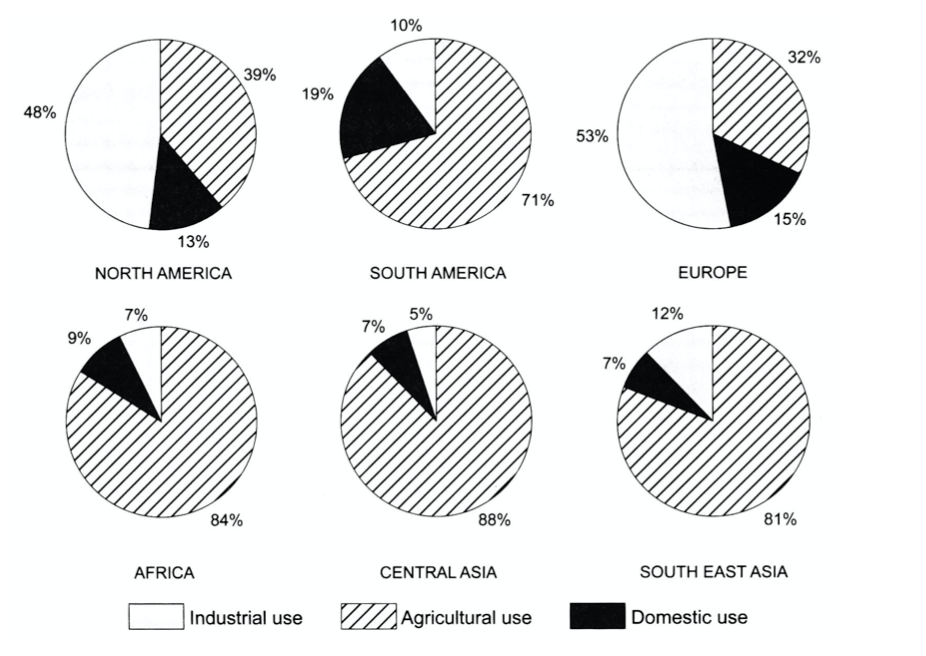
In this example, you are given six pie charts. Although this may seem like a lot of information, you should follow clear guidelines for grouping the data logically. Notice that there are three purposes for water consumption in this example: industrial use, agricultural use, and domestic use. In this case, it is best to group the information based on these purposes rather than by region.
Most countries (except North America and Europe) have a high percentage of water consumption for agricultural use. With this in mind, it is best to group “Agricultural Use” as one category and “Industrial and Domestic Use” as the other. This approach is both logical and consistent with a two-paragraph structure.
Following this structure, we can make logical groupings based on the main purposes across the six regions. Remember: highlight key features and make comparisons when relevant. Avoid listing every number—focus on the highest and lowest figures.
|
Body Paragraph 1: |
Industrial Use: North America and Europe consume roughly 50% of their water for industrial purposes. |
|
Body Paragraph 2: |
South America, Africa, Central Asia, and South-East Asia have the highest proportions of water used for agriculture. |
Note that we have more information in the first body paragraph since it discusses both industrial and domestic use. This is acceptable as long as you maintain a balanced word count and avoid writing excessively for one section.
Now it’s time to find the overall trend from this data. Follow these two steps to determine it:
1. Check whether one category is generally higher or lower overall.
2. Identify patterns with large or small differences across regions.
With this in mind, it is clear that industrial use is highest in North America and Europe, while agricultural use dominates in the other four regions. This is the most prominent overall trend. Domestic use does not need to be mentioned in the overview because it is less significant as a general pattern.
Step 2: Write an essay using the recommended structure
Using the notes from Step 1, let’s write the essay following the model below:
Introduction
The pie charts provide information about the proportion of water used for industrial, agricultural, and domestic purposes across six regions.
Overview
In general, water is used mainly for industrial purposes in North America and Europe, whereas in other regions such as South America, Africa, Central Asia, and South-East Asia, it is predominantly used for agriculture.
Body Paragraph 1
Regarding industrial and domestic use, North America and Europe consume about 50 percent of their total water for industrial purposes. However, these two regions use much less for domestic purposes—13% and 15%, respectively. South America shows the highest domestic consumption, nearly 20%, while using only 10% for industrial activities. In contrast, both industrial and domestic use are the least significant categories in Africa, Central Asia, and South-East Asia, where together they account for less than 20% of total water use.
Body Paragraph 2
Agricultural use, on the other hand, accounts for 71% of total water consumption in South America and over three-quarters of water use in Africa, South-East Asia, and Central Asia, where it reaches almost 90%. In contrast, North America and Europe allocate less than 40% of their water for agriculture.
Word Count: 201
Important functional words are highlighted in red
Useful vocabulary and phrases are highlighted in green
Synonyms and topic vocabulary are highlighted in blue
You've completed the lesson: IELTS Academic Writing Task 1 Lesson 14 - More Than Two Pie Charts
What would you like to do next?
Select a different lesson.