Lesson Introduction
-
Video Lesson
- IELTS Academic Writing Task 1 Lesson 6 - Tables Part 1
Part 1
Hello! Welcome to lesson 6 in our IELTS Academic Writing Task 1 series. In this lesson, we’ll learn how to analyze and write about tables.
Many students prepare for IELTS Writing Task 1 by learning about pie charts, line graphs, and bar charts, but they often overlook tables. In some cases, tables appear together with other visuals, like pie or line graphs—but let’s first master analyzing tables independently.
As discussed in previous lessons, it’s essential to group information into two body paragraphs. Grouping data in tables can be tricky without enough practice. We recommend visiting our “IELTS QUESTIONS” section after this lesson to practice table-based questions.
Let’s start with our first example question!
The table below gives average yearly weather statistics of four cities. Summarize the information by selecting and reporting the main features, and make comparisons where relevant. Write at least 150 words.
| Average Statistics for: | Edinburgh | Paris | Helsinki | Casablanca |
|---|---|---|---|---|
| Total Annual Rainfall | 550 mm | 700 mm | 500 mm | 26 mm |
| Number of Wet Days | 150 | 78 | 181 | 5 |
| Annual Snowfall | 75 mm | 10 mm | 450 mm | 0 |
| Annual Temperature Range | 5–15°C | 9–25°C | −10–18°C | 9–35°C |
| Hours of Sunlight per Day | 4 | 6.5 | 4.7 | 9 |
Step 1: Analyze the table and plan how to group the information
First, organize the information into two groups. For this task, it’s best to group data by meaning or similarity.
The first three categories — Total Annual Rainfall, Number of Wet Days, and Annual Snowfall — can be grouped together as Precipitation. The remaining two — Annual Temperature Range and Hours of Sunlight per Day — can form a second group called Heat Difference and Sunny Hours.
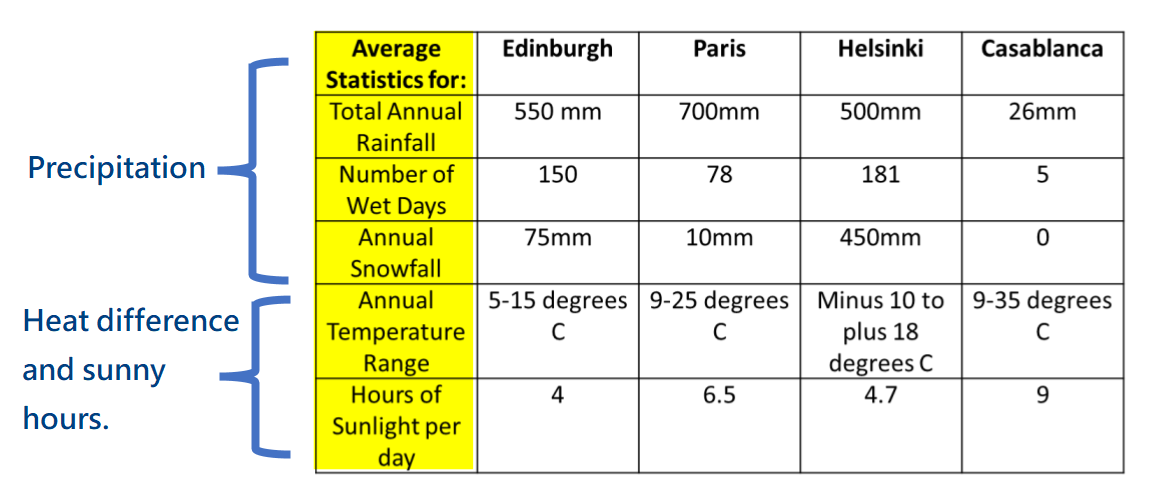
Next, identify which information stands out. Look for the highest and lowest values within each category. You don’t need to mention every number—focus on key differences.
| Average Statistics for: | Edinburgh | Paris | Helsinki | Casablanca |
|---|---|---|---|---|
| Total Annual Rainfall | 550 mm | 700 mm | 500 mm | 26 mm |
| Number of Wet Days | 150 | 78 | 181 | 5 |
| Annual Snowfall | 75 mm | 10 mm | 450 mm | 0 |
| Annual Temperature Range | 5–15°C | 9–25°C | −10–18°C | 9–35°C |
| Hours of Sunlight per Day | 4 | 6.5 | 4.7 | 9 |
Step 2: Write an essay using the recommended structure
Now that you’ve grouped and analyzed the data, try writing your essay using the structure and language from earlier lessons. Then, compare it with the model below.
Model Essay
The table below gives average yearly weather statistics of four cities. Summarize the information by selecting and reporting the main features, and make comparisons where relevant. Write at least 150 words.
Important functional words are highlighted in red.
Useful vocabulary and phrases are highlighted in green.
Synonyms and topic vocabulary are highlighted in blue.
Introduction
The table provides information about annual weather conditions in Edinburgh, Paris, Helsinki, and Casablanca.
In the introduction, paraphrase the task question clearly and naturally.
Overview
Overall, although Paris records the most annual rainfall, Helsinki experiences the greatest number of rainy days and the highest snowfall. Casablanca differs most, being the warmest, driest, and having the most sunshine hours.
The overview summarizes the key trends and groupings without mentioning specific data or numbers.
Body Paragraph 1
In terms of precipitation, Paris receives the highest rainfall at 700 mm, while Helsinki has the greatest snowfall at 450 mm—over four times more than any other city. In contrast, Casablanca experiences minimal rainfall at 26 mm annually, only five rainy days, and no snow at all.
This paragraph focuses on the “Precipitation” group. Include only data that stand out significantly.
Body Paragraph 2
As for temperature range and sunshine, Helsinki and Casablanca both show wide variations—28°C and 26°C, respectively. Moreover, Casablanca enjoys the highest sunlight duration at 9 hours per day, far exceeding Paris’s 6.5 hours and Edinburgh’s 4 hours.
This paragraph focuses on “Heat Difference and Sunny Hours,” again highlighting only the key figures that stand out.
Part 2
You've completed the lesson: IELTS Academic Writing Task 1 Lesson 6 - Tables Part 1
What would you like to do next?
Select a different lesson.