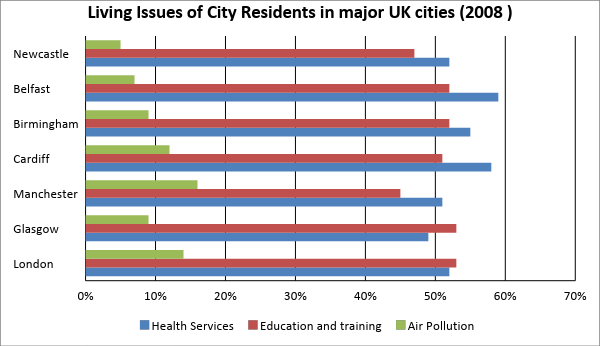
The chart below gives some of the most reported issues among people living in UK cities in 2008 (%).
Summarise the information by selecting and reporting the main features, and make comparisons where relevant.
Write at least 150 words.
Get your essay scored with grammar corrections and a detailed score report.
assignment
Get premium writing review
Sample Premium Writing Review
Score Summary
AI Review
Grammar Corrections & Feedback
Academic language suggestion in blue
General comments in green
Detailed Feedback
Essay Grammar Corrections & Improvements
Last week, I tried to submit two of my poems by through the online submission form on your website. After I upload uploaded my files and click clicked the submit button, the page suddenly show showed an error and become became blank. I did not receive any confirmation email, so I am not sure if my poems was were received or not.
Could you please tell me about the status of my submissions? I worry that maybe they did not go through.
Task Fulfillment
Strengths
- Clear purpose and request
- Good context as a reader and supporter
- Polite tone and direct question
- Key details about the problem
Clear purpose and request: Your email explains the reason for writing in a simple way. You say there was an error when you tried to submit poems and you want to know the status. The sentence “Could you please tell me about the status of my submissions?” shows a direct and clear request. This matches the goal of the email very well.
Good context as a reader and supporter: You introduce yourself as “one of your reader” and explain that you like the magazine. This context helps the staff understand who you are and why you care. Your praise of the magazine shows a positive relationship and gives a friendly start.
Polite tone and direct question: Your tone is respectful and kind. You use “I hope you are fine” and “Could you please…,” which are polite phrases. This makes your request feel friendly and professional, which is helpful in emails.
Key details about the problem: You include useful information: you submitted “two of my poems,” you used “the online submission form,” the page “show error and become blank,” and you “did not receive any confirmation email.” These details help the staff understand the problem and check the system.
Weaknesses no weaknesses were found.Overall Organization
Strengths
- Clear paragraph structure
- Logical flow from praise to problem to request
- Focused sentences in each part
- Concise length without extra ideas
Clear paragraph structure: Your email has three short paragraphs. The first gives background and praise. The second explains the problem. The third asks a question. This structure is easy to follow and helps the reader move step by step.
Logical flow from praise to problem to request: You begin with positive comments, then describe what went wrong, and finally make a request. This order makes sense and guides the reader. The staff can understand your situation quickly and see what action you want.
Focused sentences in each part: Each paragraph keeps one main idea. The first is about being a reader and feeling inspired. The second is about the submission error and no confirmation. The third is your request for the status. This focus improves clarity.
Concise length without extra ideas: You do not include unrelated stories or long explanations. The message is short and clear, so it respects the reader’s time.
Weaknesses- Transitions between parts could be smoother
- Ending could include a brief closing line for flow
Transitions between parts could be smoother: The move from praise to the problem is sudden. A short link like “However” or “Recently, I had an issue” before the second paragraph would make the change softer. For example: “However, last week I had a problem with the online form.” This small change improves the reading flow.
Ending could include a brief closing line for flow: After your question, you can add one short sentence to close smoothly, such as “Thank you for your help.” This does not add new content, but it gives a polite ending and better balance to the message.
Exercises for Improvement- Write the same email adding one transition word at the start of paragraph two and a short closing line at the end.
- Make a simple outline (Background → Problem → Request) and check each sentence fits its part.
- Practice writing three versions of endings: gratitude, availability, and expectation (e.g., “Thank you…,” “I am available…,” “I look forward to…”).
Relevance & Quality of Supporting Ideas
Strengths
- All details focus on the submission issue
- Specific information about actions and results
- Clear reason for confusion (no confirmation email)
- Polite and relevant request for status
All details focus on the submission issue: You do not include unrelated information. Your message stays on the topic of sending poems and a website error. This focus keeps the email easy to understand and helpful for the staff.
Specific information about actions and results: You say you “tried to submit two of my poems,” used “the online submission form,” clicked the submit button, and then the page “show error and become blank.” These steps show what you did and what happened, which can help the team check their system.
Clear reason for confusion (no confirmation email): You explain you did not receive a confirmation email. This is a strong supporting detail because it shows why you are not sure the poems were received. It is a common sign of a failed submission, so it makes your concern reasonable.
Polite and relevant request for status: The question you ask is exactly connected to the details you shared. It asks for the result of your submission, which matches the problem described.
Weaknesses- Some descriptions are not precise enough
- Sequence could be made clearer with small edits
Some descriptions are not precise enough: The phrase “show error and become blank” is a little unclear. You can make it stronger by saying “showed an error message and then the page went blank.” This gives a clear picture. Also, “submit… by the online submission form” sounds odd. “Through” or “via the online submission form” is more natural and precise.
Sequence could be made clearer with small edits: You can make the order of actions easier to follow with exact past tense verbs: “After I uploaded my files and clicked the submit button, the page showed an error and became blank. I did not receive a confirmation email.” This change keeps the timeline very clear.
Exercises for Improvement- Rewrite the problem sentence using exact past tense verbs and the phrase “error message” and “went blank.”
- Add one precise detail (for example, the day of the week) to practice making support stronger without adding new topics.
- Practice a three-step sequence explanation (Action → System response → Result for you) for two similar tech issues.
Grammatical Usage
Strengths
- Meaning is clear despite errors
- Polite question form used correctly
Meaning is clear despite errors: Even with grammar mistakes, the reader can understand your situation and your request. The main ideas are complete, and the message is not confusing.
Polite question form used correctly: “Could you please tell me about the status of my submissions?” is a correct and polite way to ask. This shows good control of modal verbs and polite forms.
Weaknesses- Subject–verb agreement and plural forms
- Verb tense consistency (use past tense for past actions)
- Articles and determiners
- Prepositions and natural structures
- Word form and collocations
Subject–verb agreement and plural forms: “one of your reader” should be “one of your readers.” “It make me more confidence” should be “It makes me more confident.” Also, “my poems was received” should be “my poems were received.” These changes fix agreement and plural issues.
Verb tense consistency (use past tense for past actions): Use past tense for completed actions: “After I uploaded my files and clicked the submit button, the page showed an error and became blank.” This is more correct than “upload / click / show / become.”
Articles and determiners: Add needed articles: “give a chance,” “the submit button,” “an error.” Articles help the reader understand which item you mean.
Prepositions and natural structures: “submit… by the online submission form” sounds odd. Better: “submit… through the online submission form” or “via the online submission form.” Natural prepositions make sentences smoother.
Word form and collocations: Use “confident” (adjective), not “confidence” (noun), in “It makes me more confident.” Also, “share their work” is more common than “share their works.”
Exercises for Improvement- Subject–verb agreement drill: write 10 sentences fixing errors like “It make” → “It makes,” “poems was” → “poems were.”
- Past tense practice: rewrite your second paragraph using only past tense verbs for each action.
- Articles worksheet: add a/an/the to 15 short noun phrases like “__ error,” “__ submit button,” “__ chance.”
- Preposition practice: choose the best option (through/via/by/with) in 12 submission sentences.
- Error correction: fix and explain five sentences from your email to build awareness.
Vocabulary Usage
Strengths
- Appropriate polite phrases
- Useful emotional and topic words
- Correct use of “submission(s)” and “confirmation email”
Appropriate polite phrases: You use polite sets like “I hope you are fine” and “Could you please…,” which are suitable for formal emails and show respect.
Useful emotional and topic words: Words such as “poetry magazine,” “deep,” “emotional,” “inspired,” and “peaceful” fit the context and help express your feelings clearly. They also show you understand the topic.
Correct use of “submission(s)” and “confirmation email”: These are the right terms for this situation. They make your request more precise and professional.
Weaknesses- Some awkward or incorrect collocations
- Repetition and weak intensifiers
- Lack of precise technical terms for the error
Some awkward or incorrect collocations: “give chance” should be “give a chance” or “offer opportunities.” “more confidence” should be “more confident.” “share their works” is better as “share their work.” Natural collocations make your English sound smoother.
Repetition and weak intensifiers: You repeat “very” in “really like… very much.” Choose one strong word: “I really enjoy your poetry magazine” or “I like your poetry magazine very much.” This avoids repetition and sounds more natural.
Lack of precise technical terms for the error: Instead of “show error and become blank,” use “showed an error message,” “went blank,” or “crashed.” These terms explain the problem more clearly and professionally.
Exercises for Improvement- Collocation matching: pair verbs and nouns (offer opportunities, submit via, receive confirmation, show an error message).
- Synonym practice: replace “really like… very much” with one stronger verb (enjoy, appreciate, value).
- Precision task: write three versions of the error sentence using “error message,” “blank page,” and “crashed.”
- Paraphrasing drill: rewrite the praise sentence in two different ways without repeating “very.”
Connections & Coherence
Strengths
- Logical sequencing of ideas
- Use of linking words
- Clear cause-and-effect
- Short, readable paragraphs
Logical sequencing of ideas: The email starts with background, moves to the problem, and ends with the request. This order helps the reader understand quickly and respond easily.
Use of linking words: You use some connectors like “because,” “Every time,” “After,” and “so.” These words show reasons and time order, which helps the reader follow your thoughts.
Clear cause-and-effect: You explain that the page showed an error and then you did not get a confirmation email, so you are not sure the poems were received. The link between problem and result is easy to see.
Short, readable paragraphs: The three short paragraphs make the text easy to read on a screen. Each part has one purpose, which supports coherence.
Weaknesses- Some connectors are awkward or incorrect
- Time sequence could be stronger with consistent past tense
Some connectors are awkward or incorrect: “Every time when I read” is not natural. Better: “Every time I read” or “When I read.” Small fixes like this improve the flow. Also, “After I upload…” should be “After I uploaded…” to match the time order.
Time sequence could be stronger with consistent past tense: Keeping all past actions in past tense makes the sequence very clear. For example: “After I uploaded my files and clicked the submit button, the page showed an error and became blank. I did not receive a confirmation email.” This version guides the reader step by step.
Exercises for Improvement- Linking word practice: replace or add connectors (However, Then, After that, Therefore) in your email.
- Sentence combining: join two short sentences about the error using “so,” “because,” or “after.”
- Tense sequence drill: write the problem description twice, first in present, then in past, and compare which is clearer.
Criteria Score Reports
Task Fulfillment 5/5
Task fulfillment is about how well you respond to the question you are given. IELTS raters are looking for a response that answers the question directly, with relevant ideas that are fully developed. Fulfilling the task means answering all parts of the question completely.
How to Improve
Request a review to view this content
...
Overall Organization 4/5
Overall organization is about how you organize the ideas in your essay. This includes showing that you understand how to use basic essay structure and how to organize different kinds of paragraphs around main ideas.
How to Improve
Request a review to view this content
...
Relevance & Quality of Supporting Ideas 4/5
Relevance and quality of support is about your essay content or ideas. Your content should be related directly to the topic, and you should have several main ideas that support your opinion or position. These ideas should be persuasive or compelling.
How to Improve
Request a review to view this content
...
Grammatical Usage 2/5
Grammatical usage is about how you use English grammar, sentence structure, and the basic conventions of writing. Raters want to see that you can use what you know correctly, and that you can use a wide variety of structures to express your ideas.
How to Improve
Request a review to view this content
...
Vocabulary Usage 3/5
Vocabulary usage is about how you use English words. Raters are looking for writing that uses different words correctly and accurately, and that uses a wide range of words that help readers understand. On integrated writing, raters are also looking for the ability to incorporate new words from the lecture or reading into your writing.
How to Improve
Request a review to view this content
...
Connections & Coherence 4/5
Connections and coherence are about how you put your ideas together and link different sentences to each other. Raters want to see writing that flows naturally from idea to idea without confusing the reader.
How to Improve
Request a review to view this content
...
The chart below gives some of the most reported issues among people living in UK cities in 2008 (%).
Summarise the information by selecting and reporting the main features, and make comparisons where relevant.
Write at least 150 words.
Sample Grammar Corrections
The professor explain explains that the Chevalier was rich in assets, but poor in the cash, while he lived in Switzerland and had to occasionally borrow funds while waiting for its his assets to selling. Accordingly, sell. According to the professor, being low on cash fund funds is not the same as being financially poors. poor. However, in reading the reading, someone who borrowing borrows large of amounts of money could not be wealth, wealthy, therefore the Chevalier must have lied about his wealthy life in Switzerland.
The skepticism regards regarding the reliability of the recorded conversations with Voltaire is challenging challenged by the professor as well. She explains that, due to the habit of recording each conversation with Voltaire immediately afterward, the Chevalier was able to recall those discussions in detail even after several years had passing. passed.
Finally, the professor refute refutes the idea briber that bribery was how the Chevalier got out of prison. She point points out that because even the other prisoners who had better resources were unable to successfully bribe their way out of prison prison, it was very unlikely that bribery was how he escaped. Also, she notes the existences existence of government papers recording repair work done to the Chevalier's prison cell ceiling as strong evidence that his escaping escape from the prison was accurately recorded.
writing LessonsCompleted: 0 / 101
Answer explanation starts at 33:32