
본 가이드에서는 IELTS 라이팅 task 1과 IELTS 라이팅 task 2에서 높은 점수의 에세이를 작성하는 방법을 학습하실 수 있습니다. 학술이든 일반 트레이닝이든 어떤 시험을 치르시든 모두 다루고 있습니다. 본 가이드에는 일반 라이팅 task 1 & 2와 학술 라이팅 task 1 & 2를 위한 IELTS 라이팅 샘플, 주제, 자세한 강의가 포함되어 있습니다.
아래 링크를 클릭하면 무료 아이엘츠 글쓰기 모의고사를 응시할 수 있고, 모범 답안을 받을 수 있습니다.
| 아이엘츠 General 글쓰기 시험 | 아이엘츠 Academic 글쓰기 시험 |
|---|---|
아래는 전체 아이엘츠 글쓰기 문제와 모범 답안 목록입니다. 언제든지 무료로 연습하실 수 있습니다.
아이엘츠 General 글쓰기 Task 1 샘플 1 - 44
Informal, formal, & semi-formal letters
아이엘츠 Academic 글쓰기 Task 1 샘플 1 - 52
Line graphs, bar charts, pie charts, tables, maps, flow charts, & multiple charts
아이엘츠 글쓰기 Task 2 샘플 1 - 96
Opinion, discussion, advantages & disadvantages, problem & solution, cause & effect, & two-part questions
목차
IELTS 라이팅 시험 정보
라이팅 시험은 2개의 라이팅 과제로 구성되어 있으며, 두 과제를 모두 완료하는 데 총 60분이 주어집니다. 어떤 순서로든 과제를 완료하실 수 있지만, 시간 관리를 잘 하셔서 IELTS 라이팅 task 1에는 약 20분, IELTS 라이팅 task 2에는 약 40분을 사용하시기 바랍니다.
IELTS 학술 라이팅 Task VS IELTS 일반 라이팅 Task
IELTS는 두 가지 시험 버전을 제공합니다. 학술 버전은 고등 교육을 추구하는 분들을 위한 것이며, 일반 트레이닝 버전은 단순히 이주하거나 더 낮은 수준의 교육을 받고자 하는 분들을 위한 것입니다. 두 버전 모두 더 많은 기준이 있으므로, 어떤 시험이 본인에게 적합한지 알아보시려면 IELTS 고객 서비스에 문의해 주세요.
그렇다면 어떤 시험이 더 어려운가요? 짐작하시는 대로, 학술 시험이 일반 트레이닝 시험보다 더 어렵습니다. 두 시험의 차이점은 IELTS 라이팅 task 1의 난이도입니다. 다행히도 라이팅 Task 1만 다릅니다. IELTS 라이팅 task 2는 두 시험 버전 모두 동일합니다. 아래 표는 두 가지 유형의 IELTS 라이팅 시험을 요약한 것입니다.
| 시험 종류 | Task 1 | Task 2 |
|---|---|---|
| 학술 라이팅 | IELTS 학술 라이팅 Task 1
IELTS 학술 라이팅 task 1에서는 그래프, 표, 차트 또는 도표가 제시되며, 자신의 말로 정보를 설명, 요약 또는 해석하시도록 요구됩니다. |
IELTS 라이팅 Task 2 IELTS 라이팅 task 2에서는 질문에 대한 응답으로 전통적인 스타일의 에세이를 작성하셔야 합니다. 최소 250단어를 작성하셔야 합니다. |
| 일반 라이팅 |
IELTS 일반 라이팅 Task 1
IELTS 일반 라이팅 Task 1에서는 주어진 상황에 대한 편지를 작성하시도록 요구됩니다. 이 편지는 다음 유형 중 하나입니다: - 공식적(공식 편지는 알지 못하거나 만난 적 없는 사람에게 보냅니다.) - 세미 공식적(세미 공식 편지는 잘 알지 못하는 사람에게 보냅니다.) - 비공식적(비공식 편지는 친구처럼 잘 아는 사람에게 보냅니다.) |
IELTS 학술 라이팅 Task 개요 동영상
IELTS 일반 라이팅 Task 개요 동영상
곧 공개됩니다!
IELTS 라이팅 시험 채점 방식
IELTS 라이팅 시험에서 라이팅 점수는 네 가지 카테고리를 기준으로 채점됩니다. 이들은
Task Achievement/Task Response, Coherence and Cohesion, Lexical Resource, Grammatical Range and Accuracy로 알려져 있습니다.
IELTS 시험관이 시험의 라이팅 섹션을 채점할 때 사용하는 다음 밴드 디스크립터를 참조하세요:
- IELTS 라이팅 Task 1 밴드 디스크립터
- IELTS 라이팅 Task 2 밴드 디스크립터
두 과제 모두에 대한 채점 기준에는 다음이 포함됩니다:
- Task Achievement/Task Response - 질문에 완전히 답변하고 충분히 발전된 답안을 제시하셨나요?
- Coherence and Cohesion - 논증이나 분석이 의미가 통하나요? 충분히 생각되고 완전한 방식으로 제시되었나요?
- Lexical Resource – 자연스럽고 공식적인 어조로 다양한 어휘를 사용하셨나요?
- Grammatical Range and Accuracy – 에세이에 사실상 오류가 없나요? 다양한 문법 구조를 사용할 수 있었나요?
IELTS 라이팅 Task 1과 IELTS 라이팅 Task 2의 배점은 동일한가요?
IELTS 라이팅 task 2에 두 배의 시간을 사용하시는 것처럼,
배점도 약 두 배입니다. 정확히 두 배는 아닙니다.
다른 관점에서 보면, 라이팅 task 2 점수를 두 번 더하는 것입니다. 그래서
task 1의 밴드 점수 7과 task 2의 4를 가지고
IELTS 라이팅 점수를 계산하는 다음 공식을 얻습니다:
(7 + (4 x 2))/3 = 5.
따라서 총 IELTS 라이팅 밴드 점수는 약 4.5 - 6입니다. IELTS는 채점 공식을 공개하지 않았기 때문에 정확한 숫자를 제시할 수 없지만,
여기서 제시한 공식은 약 0.5점의 차이까지는 상당히 정확합니다.
채점된 IELTS 에세이 19,000편이 보여 주는 것
2020년부터 2026년까지 BestMyTest 튜터들은 약 9,400개의 IELTS 작문 과제를 채점했으며, AI 첨삭으로 에세이 9,614편을 추가로 교정했습니다. 세 가지가 두드러집니다.
- 문법이 밴드 점수를 결정합니다. 문법의 다양성과 정확성(Grammatical Range and Accuracy)은 Task 2 에세이의 91%, 아카데믹 Task 1 보고서의 84%, 제너럴 트레이닝 편지의 94%에서 네 가지 평가 기준 중 가장 낮은 점수를 받았습니다. 튜터가 채점한 Task 2 평균 점수: 문법 5.5, 어휘력(Lexical Resource) 6.0, 일관성과 응집성(Coherence and Cohesion) 6.1, 과제 응답(Task Response) 6.1. 아카데믹 Task 1: 문법 5.5, 일관성 5.8, 과제 달성도(Task Achievement) 5.8, 어휘력 5.8. 제너럴 트레이닝 Task 1: 문법 5.3, 어휘력 5.9, 일관성 6.0, 과제 달성도 6.2.
- 짧은 에세이는 감점됩니다. Task 2 에세이의 17%는 최소 분량인 250단어에 미달했으며, 이 에세이들의 과제 응답 평균 점수는 4.9로, 250단어를 채운 에세이의 6.1보다 낮았습니다. 아카데믹 Task 1 보고서의 13%와 제너럴 트레이닝 편지의 16%는 150단어 미만이었습니다. 저희 학습자들의 평균 분량은 Task 2가 285단어, Task 1이 약 175단어입니다.
- 오류는 사소하고 반복적입니다. Task 2 에세이 한 편에는 약 21건의 교정이 이루어집니다. 문장 부호가 가장 많고(교정의 17%), 그다음은 관사(11%), 철자(10%), 명사의 단수·복수형(9%), 주어와 동사의 수 일치(7%), 전치사(6%) 순입니다. Task 2 에세이의 3분의 2에는 관사 오류가 있었고, 58%에는 주어와 동사의 수 일치 오류가 있었습니다. 아카데믹 Task 1에서는 데이터 관련 어휘로 인해 추가적인 실수가 발생합니다. "male"을 "males"로, "increase"를 "increased"로, "compare"를 "compared"로 교정하는 경우가 그 예입니다. 제너럴 트레이닝 편지에서는 대문자 사용(교정의 9%)과 동사 시제(6%)가 다른 과제에서보다 더 중요합니다.
- 저희 첨삭에서 가장 자주 이루어지는 교정: "this"를 "these"로, "is"를 "are"로, "have"를 "has"로, "in"을 "on"으로, "of"를 "for"로, "amount"를 "number"로, "then"을 "than"으로, "that"을 "who"로, "goverment"를 "government"로, "belive"를 "believe"로, "accomodation"을 "accommodation"으로.
수치는 2026년 10월까지의 BestMyTest 모의고사 및 첨삭 데이터를 바탕으로 합니다. 문제 유형별 백분율은 전체 응시 시도의 정답률이며, 평가 기준별 수치는 표시된 바에 따라 튜터 또는 AI가 부여한 점수입니다. 최종 업데이트: 2026년 10월 5일.
IELTS 학술 라이팅 Task 1
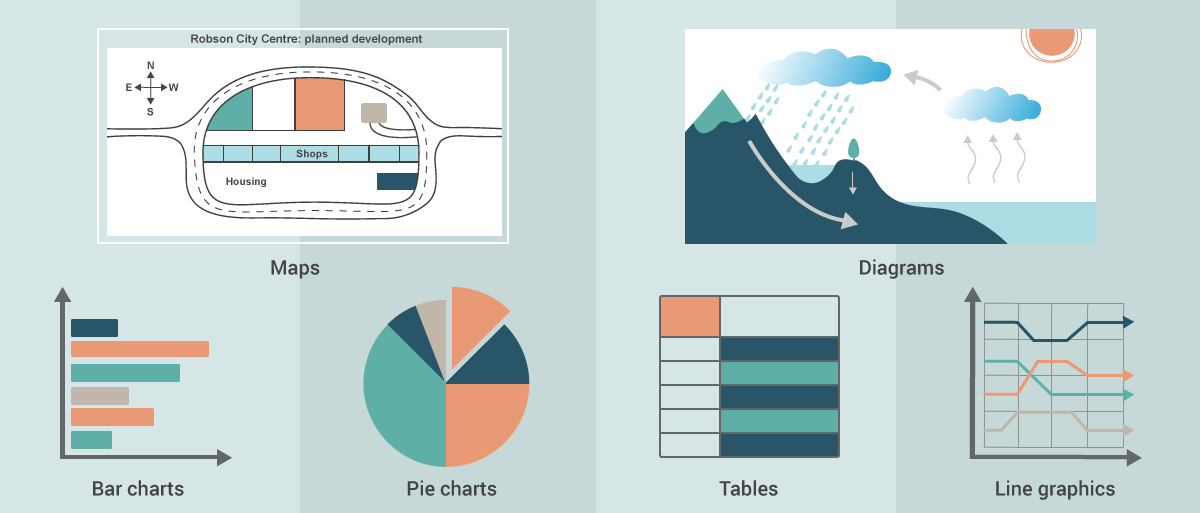
IELTS 학술 라이팅 task 1에서는 그래프, 표, 차트 또는 도표가 제시되며, 자신의 말로 정보를 설명, 요약 또는 해석하시도록 요구됩니다. 데이터를 설명하고 해석하거나, 과정의 단계, 작동 방식 또는 사물이나 사건을 설명하시도록 요구될 수 있습니다.
어떤 시각 정보가 제시되든, 당신의 역할은 시각 정보의 요약을 작성하고 주요 추세, 전반적인 차이, 주요 변화 또는 시스템의 주요 구성요소, 또는 과정의 주요 단계들을 설명하는 것입니다. 150단어 이상을 작성하셔야 하며, 시험의 이 부분에는 약 20분을 사용하셔야 합니다. 라이팅 구조는 다음과 같을 수 있습니다:
- 도입: 질문을 다른 말로 바꿔 표현
- 개요: 전반적인 추세를 설명하거나 주요 그룹의 일반적인 개요 작성
- 본문 단락 1: 첫 번째 그룹에 대해 논리적으로 자세히 작성
- 본문 단락 2: 두 번째 그룹에 대해 논리적으로 자세히 작성
이 과제의 보고서를 작성하는 단계는 매우 간단합니다:
- 차트를 분석하고 정보를 그룹화하는 방법 계획
- 추천된 에세이 구조를 사용하여 에세이 작성
- 에세이 교정
IELTS 라이팅 시험에서 마주칠 수 있는 각 다른 유형의 시각 그래프, 표, 차트, 도표를 살펴보겠습니다:
선 그래프
이 유형의 과제에서는 하나 이상의 선 그래프가 주어집니다. 각 선 그래프는 1-8개의 선이 있고 값이 시간에 따라 어떻게 변하는지 보여줍니다. 시간 기간은 과거, 현재 또는 미래 또는 세 가지 모두의 조합일 수 있습니다. 당신의 과제는 가장 중요한 점들을 다루고 데이터를 포함하여 설명을 뒷받침하는 요약을 작성하는 것입니다.
The chart illustrates average CO2 emissions per person in four European countries between 1975 and 2015.
Summarise the information by selecting and reporting the main features, and make comparisons where relevant.
- Write at least 150 words.
- You should spend around 20 minutes on this task.
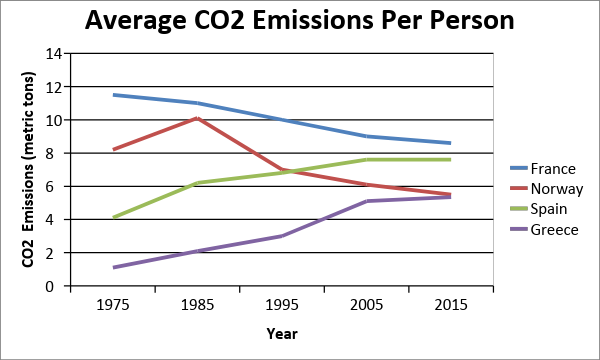
The line graph depicts the average Carbon dioxide emission for each individual residing in four countries, namely France, Norway, Spain, and Greece, over 40 years.
Overall, although CO2 production in France and Norway declined, it increased significantly in Spain and Greece over the period. Norway improved the most to become the most environmentally friendly, whereas Greece had the highest increase of all in that time.
Throughout the period, France produced the most CO2, though production declined overall from 11 tonnes per individual in 1975 to around 8.5 tonnes by 2015. In turn, except for a spike in emissions in 1985, Norway’s production of CO2 fell from 8 to under 6 tonnes forty years later.
On the contrary, CO2 release in Spain and Greece saw a more upward turn. In Spain, production doubled from 4 tonnes in 1975, overtaking Norway by 1995, to a final figure of just under 8 metric tonnes per head of population. Similarly, emissions in Greece, which were the lowest in 1975, increased five times to equal those of Norway in 2015.

Line Chart
Learn how to answer this question in a step-by-step interactive exercise
Line Chart
IELTS Academic Task 1에서는 그래프가 보여 주는 내용을 묘사해요. 의견을 말하거나 수치가 왜 그렇게 나왔는지 설명하지 않아요.
선 그래프는 시간에 따라 값이 어떻게 변하는지 보여 주며, 여러 선을 한꺼번에 보여 주는 경우가 많아요. 그래서 이 보고서는 변화를 묘사하고 선들을 비교해요.
과제를 미리 보고 다음을 클릭해 계속하세요.
문제 미리 보기
Summarise the information by selecting and reporting the main features, and make comparisons where relevant.
Write at least 150 words.
쓰기 전에 그래프를 읽으세요. 제목, 가로축의 기간, 세로축의 단위, 각 선의 이름을 알려 주는 범례를 확인하세요.
그다음 측정된 데이터가 끝나고 예측이 시작되는 지점을 찾으세요. 그 지점을 기준으로 시제가 나뉘어요. 이미 측정된 연도에는 과거형을, 아직 오지 않은 연도에는 is expected to, is predicted to, is set to 같은 형태를 써요.
그래프에 관한 질문에 답하세요.
도표 읽기
서론에서는 그래프가 보여 주는 내용을 자신의 말로 써요. 과제 문장을 패러프레이즈하세요. 표현은 바꾸되 의미는 유지하고, 주제, 선들이 측정하는 대상, 기간도 그대로 살리세요.
과제 문장을 베끼면 점수를 받지 못하고, 수치는 여기에 쓰지 않아요. 숫자는 모두 본론 단락에 쓰세요.
과제를 패러프레이즈한 문장을 한두 개 쓰세요.
서론 쓰기
과제 문제
The chart illustrates average CO2 emissions per person in four European countries between 1975 and 2015.
Summarise the information by selecting and reporting the main features, and make comparisons where relevant.
Write at least 150 words.
Task 1 보고서에는 선 그룹마다 본론 단락이 하나씩 필요한데, 선 그래프에는 보통 그룹보다 선이 더 많아요. 같은 방향으로 움직이는 선끼리 묶으세요. 오르는 선, 내리는 선, 그대로 유지되는 선으로요. 모든 선이 같은 방향으로 움직이면 단락이 하나, 세 종류가 하나씩 있으면 단락이 세 개가 돼요.
선마다 단락을 하나씩 만들거나 기간을 반으로 나눠 단락을 만들면, 과제가 요구하는 비교가 무너져요. 수준만 보고 묶으면 오르는 선과 내리는 선이 한 단락에 들어갈 수도 있어요.
각 단락에 분명한 패턴이 하나씩 담기는 그룹 나누기를 고르세요.
그룹 만들기
각 단락에 분명한 패턴이 하나씩 담기는 그룹 나누기를 고르세요.
- Group 1: Norway, Spain, Greece. Group 2: France.
- Group 1: Greece. Group 2: France, Norway, Spain.
- Group 1: Norway, Greece. Group 2: France, Spain.
- Group 1: France, Norway. Group 2: Spain, Greece.
개요는 그래프 전체에서 가장 큰 패턴이에요. 주요 특징들이 개요를 이뤄요. 먼저: 기간 전체에 걸쳐 각 그룹의 전체적인 방향은 어떤가요? 그다음: 그룹이 둘 이상이면 가장 높은 그룹과 가장 낮은 그룹은 얼마나 떨어져 있고, 그 차이는 커지나요, 줄어드나요, 아니면 순위가 뒤바뀌나요?
이 특징들을 합치면 개요가 돼요. 여기에는 개별 연도나 수치를 넣지 마세요. 그것은 본론 단락에 쓰세요.
개요를 만들 주요 특징을 찾으세요.
전체 추세 찾기
이제 두 가지 주요 특징을 한두 문장으로 만드세요. 개요는 채점관이 보고서에서 가장 먼저 찾는 부분이니, 세부 내용보다 먼저 쓰고 일반적인 내용으로 유지하세요.
그래프에 맞는 시제를 쓰고, 왜 그런지가 아니라 그래프가 무엇을 보여 주는지 묘사하세요. 수치를 쓰지 말고 의견도 덧붙이지 마세요.
가장 큰 패턴에 대해 일반적인 문장을 한두 개 쓰세요.
개요 쓰기
본론 단락 1은 기간 전체에 걸쳐 첫 번째 선 그룹만 다루며, 수치는 여기에 써요.
선 위의 모든 지점이 아니라 각 선의 모양을 묘사하세요. 시작 값, 방향, 방향이 바뀌는 곳, 마지막 값이나 예측 값이에요. rise steadily, fluctuate, level off, peak 같은 시간에 따른 변화 표현을 쓰고, 수치마다 연도를 함께 쓰세요.
어떻게 표현할지 모르겠으면 그 항목을 클릭하세요. 예시 문장이 작성란에 추가돼요.
첫 번째 그룹에 대해 수치를 넣어 세네 문장을 쓰세요.
본론 단락 1 쓰기
본론 단락 2는 두 번째 선 그룹만 다뤄요. 같은 방식으로 각 선의 모양을 쓰고 수치로 뒷받침하세요.
본론 단락 1을 반복하지 마세요. 짚어 줄 만한 차이가 있으면 in contrast, far lower than 같은 표현으로 그룹을 연결하세요.
어떻게 표현할지 모르겠으면 그 항목을 클릭하세요. 예시 문장이 작성란에 추가돼요.
두 번째 그룹에 대해 수치를 넣어 세네 문장을 쓰세요.
본론 단락 2 쓰기
보고서 계획이 완성됐어요. 완성된 Task 1 답안은 다음 순서로 구성돼요. 과제를 패러프레이즈한 서론, 가장 큰 패턴을 담은 개요, 그리고 골라낸 수치로 그 패턴을 뒷받침하는 그룹별 본론 단락이에요.
각 부분을 함께 읽으며 세 가지를 확인하세요. 개요와 세부 내용이 일치하는지, 시제가 측정값과 예측값에 맞는지, 모든 수치에 단위와 연도가 붙어 있는지예요.
보고서 계획을 검토한 뒤 모범 답안과 비교해 보세요.
보고서 전체 계획
판단 방법
IELTS Academic Task 1 선 그래프는 시간에 따라 값이 어떻게 변하는지를 보여 주고, 여러 개의 선이 함께 나오는 경우가 많아요. 그 변화를 설명하고 선끼리 비교하면 돼요. 모든 선의 모든 지점이 필요한 것은 아니에요.
첫 문장을 쓰기 전에 보고서 계획이 끝나도록 정해진 순서대로 진행하세요.
- 도표 읽기. 제목, 기간, 단위, 범례를 확인하고, 측정된 데이터가 어디서 끝나고 예측이 어디서 시작되는지 확인하세요.
- 서론 쓰기. 과제를 패러프레이즈하고 그래프가 무엇을 보여 주는지 밝히세요.
- 그룹 만들기. 본론 단락마다 분명한 생각이 하나씩 담기도록 비슷하게 움직이는 선끼리 묶으세요.
- 전체 추세 찾기. 개별 값을 보기 전에 그래프 전체에서 가장 큰 패턴을 정하세요.
- 보고서를 단계별로 쓰기. 개요를 먼저 쓰고, 그다음 그룹마다 고른 수치를 넣어 본론 단락을 하나씩 쓴 뒤, 전체 계획을 검토하세요.
선을 설명하기 전에 먼저 묶으세요. 선이 많은 그래프도 비슷한 선끼리 한 단락에 묶으면 짧은 보고서가 돼요. 이렇게 묶는 것이 바로 과제가 말하는 ‘주요 특징 고르기’예요.
그래프 읽기
축부터 보세요. 가로축은 기간, 세로축은 단위를 나타내고, 범례는 각 선의 이름을 알려 줘요. 측정된 데이터가 끝나는 지점을 찾으세요. 그 뒤는 모두 예측이므로 미래 표현을 써야 해요.
서론
서론은 그래프가 무엇을 보여 주는지 과제와 다른 말로 쓴 한두 문장이에요. 주제, 선이 측정하는 것, 기간은 남기고, 수치와 추세는 빼세요.
그룹
Task 1 보고서에는 선 그룹마다 본론 단락이 하나씩 있어요. 같은 방향으로 움직이는 선끼리 묶으세요. 올라가는 선, 내려가는 선, 변화가 없는 선으로요. 모든 선이 같은 방향으로 움직이면 단락이 하나, 세 종류가 하나씩 있으면 단락이 세 개가 돼요.
전체 추세
전체 추세는 그래프에서 가장 큰 패턴이에요. 기간 전체에 걸친 각 그룹의 전반적인 방향과 그룹 사이의 거리가 어느 정도로 유지되는지를 말해요. 이것은 일반적인 진술이므로 수치를 넣지 않아요.
IELTS 학술 라이팅 Task 1 선 그래프에 대처하는 방법을 배우려면, IELTS 학술 라이팅 Task - 선 그래프 레슨을 확인하세요.
7일 무료 체험막대 차트
이 유형의 과제에서는 하나 이상의 막대 차트가 주어집니다. 막대 차트는 시간에 따른 값의 변화(동적 데이터), 한 시점에서의 값들의 차이(정적 데이터), 또는 설문이나 설문조사 결과를 보여줄 수 있습니다. 정보는 과거, 현재 또는 미래의 상황 또는 세 가지 모두의 조합에 관한 것일 수 있습니다. 당신의 과제는 가장 중요한 점들을 다루고 데이터를 포함하여 설명을 뒷받침하는 요약을 작성하는 것입니다.
The chart below shows the proportion of males and females in Malaysia who commonly do physical activity in 2010.
Summarise the information by selecting and reporting the main features, and make comparisons where necessary.
- Write at least 150 words.
- You should spend around 20 minutes on this task.
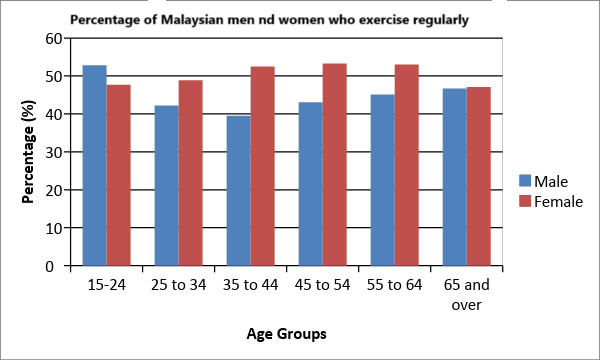
The bar chart compares the proportion of male and females of differing age groups who frequently undertook physical activity in 2010.
Overall, while the Malaysian population keeps fit in general, a higher proportion of women than men exercised in 2010, with some further differences between age groups. Middle-aged females were the most likely to work out, while for men, those aged 15 to 24 tended to do the most physical activity.
In terms of men’s exercise habits, younger men were much more likely to exercise than older men with 52.8% of those aged under 24 exercising as opposed to only around 40% of older age groups
By contrast, around half of all women in all age groups reported keeping fit, especially those aged between 35 and 64 at around 53%. The exception was the youngest age group in which only 47.7 percent of women exercised compared to 52.8% of men. Similarly, for people 65 and over, just approximately 47% of both sexes were recorded regularly working out.
Bar Chart
Learn how to answer this question in a step-by-step interactive exercise
Bar Chart
IELTS Academic Task 1에서는 그래프가 보여 주는 내용을 묘사해요. 의견을 말하거나 수치가 왜 그렇게 나왔는지 설명하지 않아요.
막대그래프는 여러 범주에 걸쳐 그룹을 비교하므로, 이 보고서는 시간에 따른 변화가 아니라 비교를 중심으로 구성돼요.
과제를 미리 보고 다음을 클릭해 계속하세요.
문제 미리 보기
Summarise the information by selecting and reporting the main features, and make comparisons where necessary.
Write at least 150 words
쓰기 전에 그래프를 읽으세요. 제목, 가로축의 범주, 세로축의 단위, 각 막대 그룹의 이름을 알려 주는 범례를 확인하세요.
단위에 따라 표현이 달라져요. 사람 수, 백분율, 금액은 서로 다른 것이고, 단위를 잘못 쓰면 나머지 문장이 맞아도 감점돼요.
그래프에 관한 질문에 답하세요.
도표 읽기
서론에서는 그래프가 보여 주는 내용을 자신의 말로 써요. 과제 문장을 패러프레이즈하세요. 표현은 바꾸되 의미는 유지하고, 주제, 비교하는 그룹, 과제에 나온 장소나 시간도 그대로 살리세요.
과제 문장을 베끼면 점수를 받지 못하고, 수치는 여기에 쓰지 않아요. 숫자는 모두 본론 단락에 쓰세요.
과제를 패러프레이즈한 문장을 한두 개 쓰세요.
서론 쓰기
과제 문제
The chart below shows the proportion of males and females in Malaysia who commonly do physical activity in 2010.
Summarise the information by selecting and reporting the main features, and make comparisons where necessary.
Write at least 150 words
Task 1 보고서에는 그룹마다 본론 단락이 하나씩 필요하니, 데이터를 어떻게 나눌지 일찍 정하세요. 범례의 계열 중 비슷하게 움직이는 것끼리 묶으세요. 비슷한 수준에 있거나, 같은 범주에서 함께 높고 함께 낮은 계열은 한 단락에 넣어요. 다르게 움직이는 계열은 따로 단락을 만들어요. 그러면 각 단락에 분명한 생각이 하나씩 담겨요.
높은 값과 낮은 값만 나누거나 범주마다 단락을 따로 만들면 같은 말을 되풀이하게 돼요.
각 단락에 분명한 생각이 하나씩 담기는 그룹 나누기를 고르세요.
그룹 만들기
각 단락에 분명한 생각이 하나씩 담기는 그룹 나누기를 고르세요.
- Group 1: Female. Group 2: Male.
- One group: Male and Female.
개요는 그래프 전체에서 가장 큰 패턴이에요. 최대 세 가지 주요 특징으로 이루어져요. 대부분의 범주에서 더 높은 그룹은 어디인가요? 대부분의 범주에서 가장 낮은 그룹은 어디인가요? 차이는 모든 범주에서 비슷한가요, 아니면 한 범주만 크게 다른가요?
모든 그래프에 세 가지가 다 나타나지는 않으므로, 이 단계에서는 이 그래프에서 중요한 특징만 물어봐요. 그것들을 합치면 개요가 돼요. 여기에는 개별 수치를 넣지 마세요. 수치는 본론 단락에 쓰세요.
개요를 만들 주요 특징을 찾으세요.
전체 추세 찾기
이제 찾은 주요 특징을 한두 문장으로 만드세요. 개요는 채점관이 보고서에서 가장 먼저 찾는 부분이니, 세부 내용보다 먼저 쓰고 일반적인 내용으로 유지하세요.
그래프가 왜 그런지가 아니라 무엇을 보여 주는지 묘사하세요. 수치를 쓰지 말고 의견도 덧붙이지 마세요.
가장 큰 패턴에 대해 일반적인 문장을 한두 개 쓰세요.
개요 쓰기
본론 단락 1은 첫 번째 그룹만 다루며, 수치는 여기에 써요.
중요한 비교를 골라 쓰세요. 가장 높은 값, 가장 낮은 값, 그리고 나머지와 다르게 움직이는 범주예요. 막대그래프는 같은 시기의 그룹을 비교하므로 higher than, twice as many as, the largest of all the categories 같은 비교 표현을 쓰세요.
어떻게 표현할지 모르겠으면 그 항목을 클릭하세요. 예시 문장이 작성란에 추가돼요.
첫 번째 그룹에 대해 수치를 넣어 세네 문장을 쓰세요.
본론 단락 1 쓰기
본론 단락 2는 두 번째 그룹만 다뤄요. 첫 번째 그룹과 똑같이, 가장 분명한 비교를 수치로 뒷받침하세요.
본론 단락 1을 반복하지 마세요. 짚어 줄 만한 차이가 있으면 in contrast, compared with 같은 표현으로 그룹을 연결하세요.
어떻게 표현할지 모르겠으면 그 항목을 클릭하세요. 예시 문장이 작성란에 추가돼요.
두 번째 그룹에 대해 수치를 넣어 세네 문장을 쓰세요.
본론 단락 2 쓰기
보고서 계획이 완성됐어요. 완성된 Task 1 답안은 다음 순서로 구성돼요. 과제를 패러프레이즈한 서론, 가장 큰 패턴을 담은 개요, 그리고 골라낸 수치로 그 패턴을 뒷받침하는 그룹별 본론 단락이에요.
각 부분을 함께 읽으며 세 가지를 확인하세요. 개요와 세부 내용이 일치하는지, 모든 수치에 단위가 붙어 있는지, 그래프를 설명하지 않고 묘사했는지예요.
보고서 계획을 검토한 뒤 모범 답안과 비교해 보세요.
보고서 전체 계획
판단 방법
IELTS Academic Task 1 막대그래프 문제는 그래프가 무엇을 보여 주는지 설명하고 그 안의 그룹을 비교하라고 해요. 모든 숫자가 필요한 것이 아니라, 중요한 비교가 필요해요.
첫 문장을 쓰기 전에 보고서 계획이 끝나도록 정해진 순서대로 진행하세요.
- 도표 읽기. 무엇을 쓰기 전에 제목, 범주, 단위, 범례를 확인하세요.
- 서론 쓰기. 과제를 패러프레이즈하고 그래프가 무엇을 보여 주는지 밝히세요.
- 그룹 만들기. 본론 단락마다 분명한 생각이 하나씩 담기도록 데이터를 나누세요.
- 전체 추세 찾기. 개별 값을 보기 전에 그래프 전체에서 가장 큰 패턴을 정하세요.
- 보고서를 단계별로 쓰기. 개요를 먼저 쓰고, 그다음 그룹마다 고른 수치를 넣어 본론 단락을 하나씩 쓴 뒤, 전체 계획을 검토하세요.
분명한 개요가 숫자를 더 넣는 것보다 가치 있어요. 과제는 주요 특징을 골라 쓰라고 하므로, 모든 값을 나열하는 것보다 일반적인 진술 하나와 강력한 비교 몇 가지가 더 높은 점수를 받아요.
도표 읽기
축부터 보세요. 가로축은 무엇을 비교하는지, 세로축은 단위를 나타내고, 범례는 각 막대 그룹의 이름을 알려 줘요. 단위를 잘못 쓴 보고서는 모든 문장의 의미가 달라져요.
서론
서론은 그래프가 무엇을 보여 주는지 과제와 다른 말로 쓴 한두 문장이에요. 주제, 비교하는 그룹, 장소나 시기는 남기고, 수치와 추세는 빼세요.
그룹
Task 1 보고서에는 그룹마다 본론 단락이 하나씩 있어요. 범례의 계열 중 비슷하게 움직이는 것끼리 묶으세요. 비슷한 수준에 있는 계열이나, 같은 범주에서 함께 높고 낮은 계열끼리요. 그러면 단락마다 생각이 하나씩 담기고 같은 말을 반복하지 않게 돼요.
전체 추세
전체 추세는 그래프에서 가장 큰 패턴이에요. 대부분의 범주에서 어느 그룹이 더 높은지, 어느 그룹이 가장 낮은지, 그리고 그 차이가 모든 범주에서 비슷한지 아니면 한 범주만 크게 다른지를 말해요. 그래프에 따라 이 중 하나, 둘, 또는 셋 모두가 나타날 수 있어요. 이것은 일반적인 진술이므로 수치를 넣지 않아요.
막대 차트는 IELTS 라이팅 task 1 학술에서 꽤 일반적입니다. 막대 차트 과제에서 마주칠 세 가지 다른 시나리오가 있습니다:
- x축에 카테고리가 있는 막대 차트
- 축에 날짜나 연도가 있는 막대 차트(선 그래프처럼 작동)
- 두 개의 막대 차트가 제시됨
각 시나리오는 보고서를 다르게 작성하는 것을 요구합니다. 7일 무료 체험에 가입하여 다음 막대 차트 레슨에 액세스하세요:
- IELTS 학술 라이팅 Task - 막대 차트 Part 1 레슨.
- IELTS 학술 라이팅 Task - 막대 차트 Part 2 레슨.
- IELTS 학술 라이팅 Task - 막대 차트 Part 3 레슨.
원형 차트
이 유형의 과제에서는 하나, 둘 또는 세 개의 원형 차트가 주어집니다. 원형 차트는 총 수치의 백분율을 보여줄 수 있습니다. 하나의 원형 차트가 있다면, 그것은 한 시점(정적 데이터)을 나타냅니다. 두 개 이상의 원형 차트가 있다면, 그것들은 백분율이 시간에 따라 어떻게 변하는지 또는 다른 국가나 그룹을 비교하는 것을 나타낼 수 있습니다. 당신의 과제는 가장 중요한 점들을 다루고 데이터를 포함하여 설명을 뒷받침하는 요약을 작성하는 것입니다.
The charts below show the percentage of water used for different purposes in six areas of the world. Summarise the information by selecting and reporting the main features, and make comparisons where relevant.
- Write at least 150 words.
- You should spend around 20 minutes on this task.
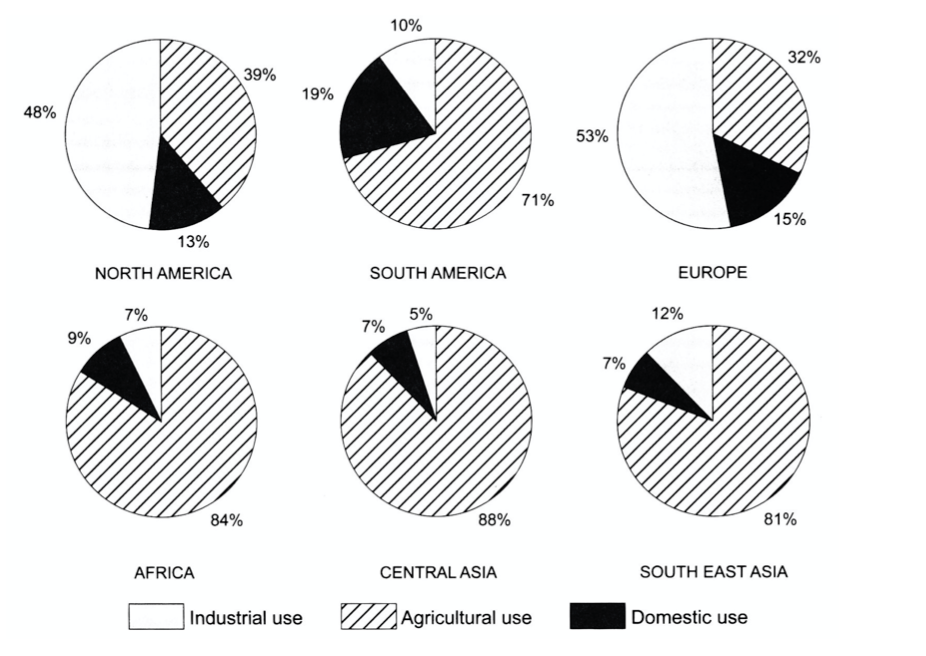
The pie charts provide information regarding the proportions of water used for industrial, agriculture, and domestic use in six regions.
In general, water serves mostly an industrial purpose in North America and Europe, whereas it is predominantly used for agriculture in South America, Africa, Central Asia, and South-East Asia.
Regarding industrial and domestic use, North America and Europe consume an average of approximately 50 percent of water for industrial purposes. However, these two regions report much less water consumption for domestic purposes, utilizing 13 percent and 15 percent, respectively. Out of all six regions, South America dedicates the highest percentage of water consumption for domestic use, but uses only 10 percent for industrial reasons. Both industrial and domestic use remain the least popular choices in Africa, Central Asia, and South-East Asia, where their combined use makes up less than 20 percent of the overall water consumption in each of the three regions.
Agricultural use, on the other hand, accounts for 71 percent of water consumption in South America and over three-fourths of water use in Africa, South-East Asia, and Central Asia, where it is nearly 90 percent. North America and Europe consume less than 40 percent of water for agricultural purposes.
IELTS 학술 라이팅 Task 1 원형 차트에 대처하는 방법을 배우려면, 7일 무료 체험에 가입하여 IELTS 학술 라이팅 Task - 원형 차트 레슨에 액세스하세요.
7일 무료 체험표
이 유형의 과제에서는 데이터를 포함하는 표가 주어집니다. 시간에 따라 변하는 동적 수치나 한 시점의 정적 데이터를 보여줄 수 있습니다. 종종 너무 많은 정보가 있어서 모든 세부 사항을 포함할 수 없습니다. 당신의 과제는 가장 중요한 점들을 다루고 데이터를 포함하여 설명을 뒷받침하는 요약을 작성하는 것입니다.
The table below gives the average time spent and distance traveled by UK commuters in one year. Time and distance are given in minutes and miles accordingly.
Summarise the information by selecting and reporting the main features, and make comparisons where relevant.
Commuting Habits of different regions of the UK in a year
UK Region | Average Commuting Time (minutes) | Average Commuting Distance (miles) |
London | 54 | 14 |
South East | 78 | 20 |
Scotland | 45 | 19 |
West Midlands | 39 | 18 |
North West | 36 | 18 |
Northern Ireland | 36 | 15 |
Yorkshire & Humberside | 36 | 14 |
South West | 34 | 16 |
East Anglia | 33 | 15 |
North East | 32 | 19 |
East Midlands | 32 | 15 |
Wales | 27 | 14 |
- Write at least 150 words.
- You should spend around 20 minutes on this task.
The table shows data on the average commuting time (minutes) and distance (miles) completed by UK citizens in 12 different regions in one year.
Overall, with the exception of London, the further people travel, the more time they need to reach work people. Commuters in the south east region spend the longest time commuting over the greatest distance, whereas people in Wales spend the least.
Regarding the top three UK regions, on average, people in the south east travel both the farthest and longest at 20 miles over 78 minutes. Likewise inhabitants of Scotland journey a similar distance to work, yet spend almost half the time doing so at 45 minutes to get there, while those living in London spend the second-longest time travelling (54 minutes) over just 14 miles.
Of the other regions, people in the West Midlands spent the most time travelling at 39 minutes whereas those in Wales recorded the lowest time at 27 minutes. With regard to distance, residents of the North East, West Midlands and North West recorded the greatest mileage at 19, 18 and 18 miles respectively, while people in Yorkshire and Humberside as well as Wales both travelled the shortest distance to work of all at 14 miles.
IELTS 학술 라이팅 Task 1 표에 대처하는 방법을 배우려면, 7일 무료 체험에 가입하여 다음 레슨에 액세스하세요:
- IELTS 학술 라이팅 Task - 표 Part 1 레슨.
- IELTS 학술 라이팅 Task - 표 Part 2 레슨.
프로세스 다이어그램
이 유형의 질문에서는 어떤 것이 어떻게 작동하는지 보여주는 다이어그램이 주어집니다.
다이어그램은 기계, 시스템 또는 자연 현상을 보여줄 수 있습니다.
종종 데이터가 없거나 거의 포함되지 않습니다.
당신의 과제는 다이어그램에 표시된 정보를 요약하는 것입니다.
The diagram below shows the water cycle, which is the continuous movement of water on, above and below the surface of the Earth.
Summarise the information by selecting and reporting the main features.
- Write at least 150 words.
- You should spend around 20 minutes on this task.
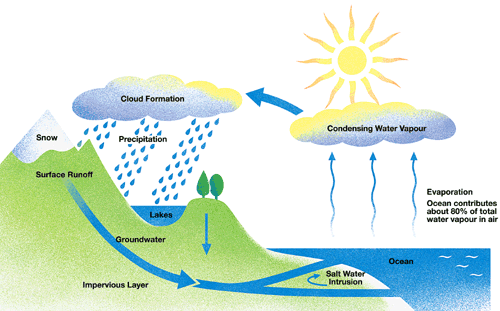
The diagram illustrates the hydrological cycle by which water moves through our natural environment. Overall, there are several stages to the process involving evaporation, precipitation and the final return of water to the ocean where the process begins over.
Since 80% of all water begins in the ocean, most water originates from this source. Initially sea water is warmed by the sun, causing it to evaporate into the air becoming water vapor. This then rises to condense into clouds at a higher elevation, which are then then pushed by the wind over land where it condenses further and precipitation occurs, falling as either snow or rain.
After precipitation on land, water then takes one of three routes. Some of it may fall into lakes or return to the ocean as surface runoff. Still further water percolates underground to an impermeable layer where it again flows back to the sea. Salt water also intrudes from the ocean into the land in coastal areas.

Process Diagram
Learn how to answer this question in a step-by-step interactive exercise
Process Diagram
IELTS Academic Task 1 과정 다이어그램 과제는 무언가가 어떻게 만들어지는지, 또는 어떤 시스템이 어떻게 작동하는지를 단계별로 보여 줘요. 다이어그램에 나온 순서대로 단계를 보고하고, 이유나 의견은 쓰지 않아요.
과제 문제를 미리 보고 다음을 클릭해 계속하세요.
문제 미리 보기
Summarise the information by selecting and reporting the main features.
Write at least 150 words.
무엇이든 쓰기 전에 다이어그램을 확실히 이해하세요. 단계의 수를 세고 화살표를 따라가며 과정이 어디서 시작하는지, 어디서 끝나는지 확인하세요. 마지막 화살표가 첫 단계로 돌아가면 그 과정은 순환이고, 최종 생산물은 없어요.
다이어그램에 관한 질문에 답하세요.
도표 읽기
서론은 다이어그램이 무엇을 보여 주는지 읽는 사람에게 알려 줘요. 과제 문제를 베끼지 말고 자신의 말로 패러프레이즈하고, 어떤 과정인지 밝히세요. 여기서는 어떤 단계도 묘사하지 마세요.
서론을 한두 문장으로 쓰세요.
서론 쓰기
과제 문제
The diagram below shows the water cycle, which is the continuous movement of water on, above and below the surface of the Earth.
Summarise the information by selecting and reporting the main features.
Write at least 150 words.
IELTS Task 1 보고서에는 단계 그룹마다 본론 단락이 하나씩 필요해요. 단계마다 단락을 하나씩 쓰지 마세요. 장소, 재료, 목적이 바뀌는 자연스러운 구분점에서 과정을 나누어, 각 그룹이 차례로 이어지는 단계들로 이루어지게 하세요. 대부분의 과정은 그룹이 두 개이고, 짧은 과정은 하나, 긴 과정은 세 개일 수 있어요.
그룹을 고르세요.
그룹 만들기
그룹을 고르세요.
- Group 1: stages 1 to 2 (Evaporation to Condensing Water Vapour). Group 2: stages 3 to 4 (Cloud Formation to Precipitation). Group 3: stages 5 to 6 (Surface Runoff to Groundwater).
- Group 1: stages 1 to 3 (Evaporation to Cloud Formation). Group 2: stages 4 to 5 (Precipitation to Surface Runoff). Group 3: stage 6 (Groundwater).
- Group 1: stages 1 to 3 (Evaporation to Cloud Formation). Group 2: stages 4 to 6 (Precipitation to Groundwater).
- Group 1: stages 1 to 2 (Evaporation to Condensing Water Vapour). Group 2: stages 3 to 5 (Cloud Formation to Surface Runoff). Group 3: stage 6 (Groundwater).
개요는 과정 전체를 한눈에 요약해요. 단계가 몇 개인지, 처음부터 끝까지 주요 단계가 무엇인지 따져 보세요. 과정은 다른 것과 비교되는 일이 거의 없으므로, 증가나 감소를 찾지 말고 과정의 전체 모양을 묘사하세요.
질문에 답하며 전체 추세를 찾으세요.
전체 추세 찾기
앞 단계의 노트를 활용하세요. 개요에서는 단계의 수와 주요 단계를 밝히고, 과정이 생산물로 끝나는지 순환으로 반복되는지 말해요. 장비, 시간, 온도는 본론 단락에 쓰고, 이유나 의견은 쓰지 마세요.
개요를 한두 문장으로 쓰세요.
개요 쓰기
본론 단락 1은 첫 번째 단계 그룹을 화살표가 가리키는 순서대로 한 단계씩 묘사해요. 다이어그램에는 누가 그 일을 하는지 거의 나오지 않으므로 is heated, is mixed, is poured 같은 수동태를 쓰세요. 단계들은 first, then, after that 같은 순서 표현으로 이으세요.
본론 단락 1을 세네 문장으로 쓰세요.
본론 단락 1 쓰기
본론 단락 2는 두 번째 단계 그룹을 묘사해요. 본론 단락 1이 멈춘 지점에서 이어지므로 순서가 끊기지 않아요. 계속 수동태를 쓰고, 그룹끼리는 once, after this 같은 표현으로 연결하세요. 이 단락이 마지막 단락이라면 in the final stage나 finally로 끝을 표시하고, 과정이 순환이라면 마지막 단계가 첫 단계로 다시 이어진다고 말하세요.
본론 단락 2를 세네 문장으로 쓰세요.
본론 단락 2 쓰기
이제 각 부분이 하나의 보고서가 됐어요. 서론, 개요, 그리고 단계 그룹마다 본론 단락 하나씩이에요. 함께 읽으며 단계가 여전히 순서대로인지, 수동태가 올바른지, 보고서 길이가 충분한지 확인하세요.
보고서 계획 전체를 읽은 뒤 다음을 클릭해 모범 답안과 비교해 보세요.
보고서 전체 계획
판단 방법
과정 다이어그램 과제는 무언가가 어떻게 만들어지는지, 또는 어떤 시스템이 어떻게 작동하는지를 단계별로 보여 줘요. 다이어그램에는 정해진 순서가 있으므로, 보고서도 그 순서를 따라 첫 단계부터 마지막 단계까지 써요.
단계의 순서가 흐트러지거나 빠지는 단계가 없도록 정해진 순서대로 쓰세요.
- 도표 읽기. 단계 수를 세고 화살표를 따라가며 과정이 어디서 시작해서 어디서 끝나는지 확인하세요.
- 서론 쓰기. 세부 내용 없이 과제 문제를 패러프레이즈하고 어떤 과정인지 밝히세요.
- 그룹 만들기. 과정의 자연스러운 지점에서 단계를 그룹으로 나누고, 그룹마다 본론 단락을 하나씩 정하세요.
- 전체 추세 찾기. 단계가 몇 개인지, 처음부터 끝까지 주요 단계가 무엇인지 정하세요.
- 개요와 본론 단락 쓰기. 과정의 전체 흐름을 먼저 요약한 다음, 단계를 순서대로 설명하세요.
- 보고서 전체 계획. 각 부분을 함께 읽고 모범 보고서와 비교해 보세요.
과정 보고서는 수동태로 써요. 다이어그램은 누가 작업하는지 거의 알려 주지 않으므로, ‘is heated’, ‘is mixed’, ‘is stored’ 같은 형태를 쓰고, ‘first’, ‘after that’, ‘finally’ 같은 순서 표현으로 단계를 이으세요.
읽기
과정 다이어그램은 화살표로 이어진 단계들을 보여 줘요. 단계 수를 세고 화살표를 따라가며 과정이 어디서 시작해서 어디서 끝나는지 확인하세요. 마지막 화살표가 첫 단계로 돌아가면 그 과정은 순환 과정이고 최종 결과물은 없어요.
서론
서론은 다이어그램이 무엇을 보여 주는지 말해요. 과제 문제를 그대로 베끼지 말고 자신의 말로 패러프레이즈하고, 어떤 과정인지 밝히세요. 이 문장들에는 개별 단계를 넣지 마세요.
그룹
Task 1 보고서는 단계 그룹마다 본론 단락이 하나씩 필요해요. 단계마다 단락을 하나씩 쓰지 마세요. 장소, 재료, 목적이 바뀌는 자연스러운 지점에서 과정을 나누어, 각 그룹이 이어지는 단계들의 묶음이 되게 하세요. 대부분의 과정은 두 그룹이 되고, 짧은 과정은 한 그룹, 긴 과정은 세 그룹이 될 수 있어요.
추세
개요는 과정 전체를 한눈에 요약해요. 단계가 몇 개인지, 주요 단계가 무엇인지를 쓰세요. 과정은 다른 것과 비교하는 경우가 드물므로, 증가나 감소를 찾지 말고 과정의 전체 흐름을 설명하세요.
쓰기
개요가 먼저 오고, 장비, 시간, 온도 없이 일반적인 내용만 담아요. 그다음 각 본론 단락이 화살표가 보여 주는 순서대로 단계를 설명해요. ‘is heated’, ‘is poured’ 같은 수동태를 쓰고, ‘first’, ‘next’, ‘after that’, ‘finally’ 같은 순서 표현으로 단계를 이으세요.
IELTS 학술 라이팅 Task 1 프로세스 다이어그램에 대처하는 방법을 배우려면, 7일 무료 체험에 가입하여 IELTS 학술 라이팅 Task - 프로세스 다이어그램 레슨에 액세스하세요.
7일 무료 체험지도
이 유형의 질문에서는 하나, 둘 또는 세 개의 지도가 주어집니다.
지도는 마을, 도시, 섬 또는 다른 지리적 영역을 보여줄 수 있습니다.
지도는 일반적으로 일정 기간 동안 그 지역에서 발생한 변화를 보여줍니다.
변화는 건설(예: 관광을 위한 지역 개발)
또는 파괴(예: 지진과 같은 자연 재해의 영향을 받은 지역)와 관련될 수 있습니다
당신의 과제는 발생한 변화의 요약을 작성하고 가장 중요한 점들을 다루는 것입니다.
The maps below show the centre of a small town called Islip as it is now, and plans for its development. Summarise the information by selecting and reporting the main features, and make comparisons where relevant.
- Write at least 150 words.
- You should spend around 20 minutes on this task.
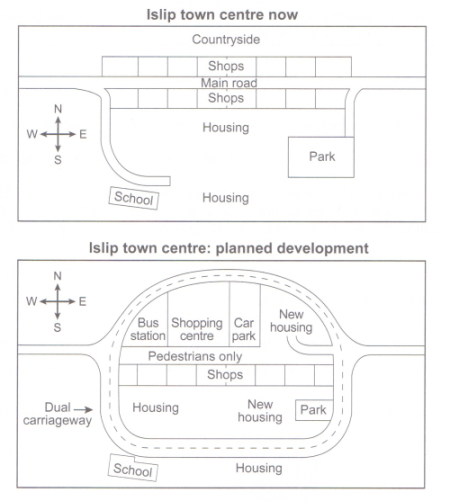
The diagrams illustrate some proposed changes to the central area of the town of Islip.
Overall, the principal change to the town will be the construction of a ring road around the centre. Various other developments with regard to shops and housing will accompany the building of this road.
As the first map reveals, lslip town center now is relatively small. There is a main road from the west to the east with shops on both sides. The northern area is rarely countryside, while the southern area is filled with houses with a school at the end of the fork road in the southwest corner and a park in the southeast area.
In the future, the main road is expected to reform into a dual carriageway as a round containing all the new buildings. The shops along the north side of the new pedestrian street will be demolished to make way for a bus station, shopping centre, car parks and new housing area. The shops along the south side of the street will remain, but it seems that the town's park will be reduced in size so that more new houses can be built within the ring road.
Map
Learn how to answer this question in a step-by-step interactive exercise
Map
IELTS Academic Task 1 지도 과제에서는 같은 장소를 서로 다른 시기에 그린 평면도가 두 개 이상, 보통 두 개 주어져요. 그 장소가 어떻게 바뀌었는지 150단어 이상의 보고서로 묘사하고, 의견이나 이유는 쓰지 않아요.
과제를 미리 보고 다음을 클릭해 계속하세요.
문제 미리 보기
Write at least 150 words.
쓰기부터 하지 말고 지도부터 읽으세요. 어떤 장소를 보여 주는지, 어떤 시점을 비교하는지, 지도가 몇 개인지 확인하세요. 그다음 새로 생긴 것, 없어진 것, 지금은 다른 용도로 쓰이는 것을 찾으세요.
지도에 관한 질문에 답하세요.
도표 읽기
서론에서는 과제를 자신의 말로 패러프레이즈해요. 지도가 무엇을 보여 주는지, 어떤 기간을 다루는지 밝히고, 과제 문장을 베끼지 말고 표현을 바꾸세요. 세부 내용, 위치 표현, 변화를 나타내는 동사는 나중에 써요.
과제를 패러프레이즈한 문장을 한두 개 쓰세요.
서론 쓰기
과제 문제
The maps below show the centre of a small town called Islip as it is now, and plans for its development. Summarise the information by selecting and reporting the main features, and make comparisons where relevant.
Write at least 150 words.
Task 1 보고서에는 지도 그룹마다 본론 단락이 하나씩 필요해요. 보통은 지도 하나가 한 그룹이에요. 이전 지도는 첫 번째 단락에, 이후 지도는 두 번째 단락에 쓰면 시점이 분명히 나뉘거든요. 함께 묘사하는 편이 가장 좋은 지도 두 개는 한 그룹으로 묶을 수 있고, 지도가 세 개면 보통 단락도 세 개가 돼요.
특징마다 단락을 하나씩 만들거나 지도를 반으로 나눠 단락을 만들면, 시점 사이의 비교가 무너져요.
본론 단락이 분명해지는 그룹 나누기를 고르세요.
그룹 만들기
본론 단락이 분명해지는 그룹 나누기를 고르세요.
- One group: now and planned development.
- Group 1: now. Group 2: planned development.
개요에서는 기간 전체에서 가장 큰 변화를 밝혀요. 그 장소가 커졌는지 작아졌는지, 어떤 종류의 토지 이용이 새로 생기거나 사라졌는지 따져 보세요. 개별 특징과 정확한 위치는 개요에 넣지 않아요.
전체적인 변화를 묘사하는 답을 고르세요.
전체 추세 찾기
이제 앞 단계의 노트를 활용해 개요를 자신의 말로 쓰세요. 한두 문장이면 충분해요. 그 장소의 전반적인 발전을 묘사하고, 정확한 위치, 개별 특징, 변화의 이유는 빼세요.
개요를 한두 문장으로 쓰세요.
개요 쓰기
첫 번째 본론 단락에서는 첫 번째 그룹의 지도를 자세히 묘사해요. 이미 끝난 상태에는 과거형을 쓰고, 읽는 사람이 각 특징의 위치를 알 수 있도록 ‘to the north of’, ‘beside’, ‘on the edge of’ 같은 위치 표현을 쓰세요. 이유가 아니라 특징을 묘사하세요.
본론 단락 1을 세네 문장으로 쓰세요.
본론 단락 1 쓰기
두 번째 본론 단락에서는 두 번째 그룹의 지도와 이전 지도 이후의 변화를 묘사해요. 지도에는 누가 그 일을 했는지 나오지 않으므로, 지어지거나 없어지거나 바뀐 것에는 ‘was built’, ‘had been cleared’, ‘has been converted’ 같은 수동태를 쓰세요. 각 변화가 어디서 일어났는지는 여전히 위치 표현으로 보여 줘요.
본론 단락 2를 세네 문장으로 쓰세요.
본론 단락 2 쓰기
이제 각 부분이 하나의 보고서가 됐어요. 서론, 개요, 그리고 지도 그룹마다 본론 단락 하나씩이에요. 순서대로 읽으며 개요는 큰 그림을 밝히고 본론 단락은 세부 내용을 담고 있는지 확인하세요.
보고서 계획을 읽은 뒤 모범 답안과 비교해 보세요.
보고서 전체 계획
판단 방법
지도 과제는 같은 장소를 서로 다른 시기에 그린 평면도 두 개 이상을 보여 줘요. 모든 라벨을 설명하는 것이 아니라, 시점 사이에 그 장소가 어떻게 변했는지를 보고하면 돼요.
세부 사항보다 큰 그림을 먼저 말하도록 정해진 순서대로 진행하세요.
- 도표 읽기. 계획하기 전에 장소, 시점, 각 지도의 주요 특징을 확인하세요.
- 그룹 만들기. 정보를 지도 그룹으로 나누고 그룹마다 본론 단락을 하나씩 정하세요. 보통 이전 지도를 먼저, 이후 지도를 나중에 써요.
- 전체 추세 찾기. 성장, 감소, 새로운 토지 이용처럼 기간 전체에 걸친 가장 큰 변화를 정하세요.
- 보고서를 단계별로 쓰기. 서론, 개요, 그리고 그룹마다 본론 단락을 하나씩 순서대로 쓰세요.
- 보고서 전체 계획. 각 부분을 함께 읽고 모범 보고서와 비교해 보세요.
지도 보고서는 위치 표현과 수동태가 이끌어 가요. ‘to the north of’, ‘beside the river’ 같은 표현으로 각 특징의 위치를 나타내고, ‘was built’, ‘had been removed’ 같은 형태로 누가 했는지 밝히지 않고 변화를 보고해요.
읽기
계획하기 전에 지도가 무엇을 보여 주는지 확인하세요. 장소, 시점, 각 지도의 주요 특징이요. 그런 다음 새로 생긴 것, 없어진 것, 지금은 다른 용도로 쓰이는 것을 찾으세요. 이렇게 먼저 읽어 두면 지도 하나만 설명하는 실수를 막을 수 있어요.
그룹
IELTS Task 1 보고서에는 지도 그룹마다 본론 단락이 하나씩 필요해요. 보통은 지도 하나가 한 그룹이고, 이전 지도를 먼저, 이후 지도를 나중에 써요. 함께 설명하는 것이 가장 좋은 지도 두 개는 한 그룹이 될 수 있고, 지도가 세 개면 보통 단락도 세 개예요. 쓰기 전에 나누는 방법을 정하세요. 그것이 보고서 전체의 순서를 결정하기 때문이에요.
개요
개요에는 작은 세부 사항이 아니라 기간 전체에 걸친 가장 큰 변화를 써요. 그 장소가 커졌는지 줄었는지, 어떤 종류의 토지 이용이 생기거나 사라졌는지 생각해 보세요. 개별 특징과 정확한 위치는 본론 단락에 들어가요.
쓰기
보고서는 짧은 단계로 만들어져요. 서론은 과제를 패러프레이즈하고, 개요는 주요 변화를 말하고, 본론 단락은 그룹마다 하나씩 설명해요. 끝난 상태에는 과거형을, 변화에는 ‘was built’나 ‘had been cleared’ 같은 수동태를 쓰고, 각 특징이 어디에 있는지는 위치 표현으로 나타내세요.
IELTS 학술 라이팅 Task 1 지도에 대처하는 방법을 배우려면, 7일 무료 체험에 가입하여 IELTS 학술 라이팅 Task - 지도 레슨에 액세스하세요.
7일 무료 체험혼합 데이터
이 유형의 과제에서는 두 세트의 데이터가 주어집니다.
데이터는 서로 다른 유형입니다. 예를 들어, 한 세트는 시간에 따른 변화이고 두 번째 세트는 정적일 수 있습니다.
대안적으로, 한 데이터 세트는 백분율을 보여주고 두 번째 세트는 숫자를 보여줄 수 있습니다.
또한 일러스트레이션(예: 다이어그램 또는 지도)과 데이터 세트(예: 막대 차트, 선 그래프, 원형 차트 또는 표)가 주어질 수도 있습니다
당신의 과제는 두 데이터 세트를 모두 요약하는 것입니다.
The pie graph depicts the main reasons for the productivity loss of agricultural land worldwide. The table shows how these causes influenced three world regions during the 2000s.
Summarise the information by selecting and reporting the main features, and make comparisons where relevant.
Causes of Land Degradation by Region (%) | ||||
Region: | Deforestation | Over-cultivation | Over-grazing | Total land degraded |
North America | 0.3 | 3.4 | 1.7 | 5.4 |
Asia | 9.8 | 7.8 | 5.7 | 23.3 |
Australia & Oceania | 1.6 | 0.3 | 11 | 12.9 |
- Write at least 150 words.
- You should spend around 20 minutes on this task.
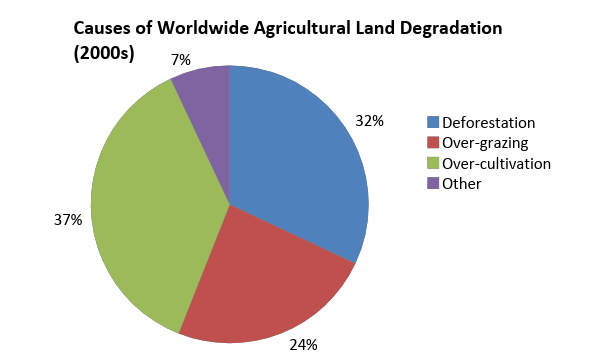
The pie chart shows the four main causes of farmland degradation in the world today, while the table presents the amount of land surface area affected by each one in three separate global regions during the 2000s.
Overall, Asia suffered more from the deterioration of farmland than other regions owing to deforestation and over-cultivation which were also the primary reasons for agricultural land loss worldwide.
Globally, 69% of degraded land is attributed to excessive cultivation and tree clearance, constituting 37% and 32% respectively. A further quarter of global land loss is due to over cultivation of crops. Other causes made up only 7% collectively.
In the 2000s, these causes affected regions of our planet differently. Asia was the worst affected where the top two causes of global land loss, deforestation and over-cultivation, resulted in 9.8% and 7.8% of degraded land there. The impact on Australia and Oceania was less severe though over-grazing was the predominant cause of land deterioration at eleven percent. The least affected of all was North America where only 5.4% of land was diminished, principally because of over-cultivation at 3.4%.
Mixed Charts
Learn how to answer this question in a step-by-step interactive exercise
Mixed Charts
IELTS Academic Task 1 혼합 그래프 과제에서는 한 주제에 대해 유형이 다른 시각 자료가 두 개 이상 주어져요. 주요 특징을 보고하고 시각 자료들을 연결하는 150단어 이상의 보고서를 쓰며, 의견이나 이유는 쓰지 않아요.
과제를 미리 보고 다음을 클릭해 계속하세요.
문제 미리 보기
Summarise the information by selecting and reporting the main features, and make comparisons where relevant.
Write at least 150 words.
쓰기부터 하지 말고 시각 자료부터 읽으세요. 각 시각 자료가 무엇을 보여 주는지 확인하고, 계획을 세우기 전에 모든 축 이름과 단위를 읽으세요. 유형이 다른 시각 자료는 서로 다른 것을 측정하는 경우가 많으니, 같은 집단이나 같은 기간처럼 공통점이 무엇인지 메모하세요.
시각 자료에 관한 질문에 답하세요.
도표 읽기
서론에서는 과제를 자신의 말로 패러프레이즈해요. 각 시각 자료가 무엇을 보여 주는지, 어떤 집단과 기간을 다루는지 분명히 하고, 과제 문장을 베끼지 말고 표현을 바꾸세요. 수치와 시각 자료 사이의 연결은 나중에 써요.
과제를 패러프레이즈한 문장을 한두 개 쓰세요.
서론 쓰기
과제 문제
The pie graph depicts the main reasons for the productivity loss of agricultural land worldwide. The table shows how these causes influenced three world regions during the 2000s.
Summarise the information by selecting and reporting the main features, and make comparisons where relevant.
Write at least 150 words.
Task 1 보고서에는 시각 자료 그룹마다 본론 단락이 하나씩 필요하고, 혼합 시각 자료는 한 개에서 세 개의 그룹으로 나뉘어요. 유형이나 주제가 같은 시각 자료는 함께 묶어요. 두 가지 측정 기준이 섞인 단락은 따라가기 어렵거든요. 같은 대상을 다룬 원그래프 두 개는 한 단락에 넣고, 다른 기준을 측정하는 선 그래프는 따로 단락을 만들어요.
시각 자료마다 단락을 하나씩 만들면 함께 다뤄야 할 것이 나뉠 수 있고, 모든 시각 자료를 한 단락에 넣으면 측정 기준이 섞여요. 연도별로 나누거나 가장 높은 수치와 가장 낮은 수치로 나누면 과제가 요구하는 비교가 무너져요.
각 단락에 측정 기준이 분명히 하나씩 담기는 그룹 나누기를 고르세요.
그룹 만들기
각 단락에 측정 기준이 분명히 하나씩 담기는 그룹 나누기를 고르세요.
- Group 1: the pie chart. Group 2: the table.
- One group: the pie chart and the table.
개요에서는 모든 시각 자료에 걸친 가장 큰 패턴을 밝히며, 개요는 세부 내용보다 먼저 와요. 각 시각 자료의 주된 움직임을 찾은 뒤, 한 시각 자료가 다른 자료를 뒷받침하거나 설명하는지 판단하세요. 정확한 수치는 개요에 넣지 않아요.
주된 패턴을 묘사하는 답을 고르세요.
전체 추세 찾기
이제 앞 단계의 노트를 활용해 개요를 자신의 말로 쓰세요. 한두 문장이면 충분해요. 주된 패턴과 시각 자료 사이의 연결을 밝히고, 정확한 수치와 그 패턴의 이유는 빼세요.
개요를 한두 문장으로 쓰세요.
개요 쓰기
첫 번째 본론 단락에서는 첫 번째 그룹을 자세히 묘사해요. 가장 높은 지점, 가장 낮은 지점, 가장 뚜렷한 변화 같은 중요한 비교를 보고하고, 각각을 골라낸 수치 몇 개로 뒷받침하세요. 숫자를 모두 나열하지 말고, 다른 그룹은 여기서 묘사하지 마세요.
본론 단락 1을 세네 문장으로 쓰세요.
본론 단락 1 쓰기
두 번째 본론 단락에서는 두 번째 그룹을 묘사하고 첫 번째 그룹과 연결해요. 범주를 하나씩 차례로 다루지 말고 함께 다뤄야 할 비교끼리 묶고, 연결 표현을 써서 시각 자료들이 일치하는 부분을 보여 주세요. 데이터가 왜 그런지가 아니라 무엇을 보여 주는지 보고하세요.
본론 단락 2를 세네 문장으로 쓰세요.
본론 단락 2 쓰기
이제 각 부분이 하나의 보고서가 됐어요. 서론, 개요, 그리고 시각 자료 그룹마다 본론 단락 하나씩이에요. 순서대로 읽으며 개요는 큰 그림을 밝히고 본론 단락은 세부 내용을 담고 있는지 확인하세요.
보고서 계획을 읽은 뒤 모범 답안과 비교해 보세요.
보고서 전체 계획
판단 방법
혼합 그래프 과제는 한 주제에 대해 유형이 서로 다른 시각 자료 두 개 이상을 보여 줘요. 시각 자료마다 보고서를 따로 쓰는 것이 아니라, 각 자료의 주요 특징을 보고하고 데이터가 연결되는 곳에서 서로 이어 주면 돼요.
세부 사항보다 큰 그림을 먼저 말하도록 정해진 순서대로 진행하세요.
- 도표 읽기. 계획하기 전에 각 시각 자료가 무엇을 보여 주는지 확인하고, 모든 축, 라벨, 단위를 읽으세요.
- 그룹 만들기. 시각 자료를 한 개에서 세 개 그룹으로 나누고 그룹마다 본론 단락을 하나씩 정하세요. 보통 그룹마다 그래프 유형이나 주제가 하나씩이에요.
- 전체 추세 찾기. 모든 시각 자료에 걸친 가장 큰 패턴을 정하고, 자료 사이의 연결 고리가 있다면 적어 두세요.
- 보고서를 단계별로 쓰기. 서론, 개요, 그리고 그룹마다 본론 단락을 하나씩 순서대로 쓰세요.
- 보고서 전체 계획. 각 부분을 함께 읽고 모범 보고서와 비교해 보세요.
모든 숫자를 나열하지 말고 의미 있는 비교끼리 묶으세요. 패턴을 뒷받침하는 몇 가지 고른 수치가, 시각 자료에 이미 나온 것을 되풀이할 뿐인 긴 목록보다 점수를 더 받아요.
읽기
유형이 다른 시각 자료는 서로 다른 것을 측정하므로, 먼저 하나씩 따로 읽으세요. 제목, 축 라벨, 단위, 기간을 확인한 다음, 같은 집단의 사람이나 같은 기간처럼 시각 자료들이 공통으로 가진 것을 적어 두세요. 원그래프의 시간 비율과 선 그래프의 총량은 같은 측정값이 아니에요.
그룹
IELTS Task 1 보고서에는 시각 자료 그룹마다 본론 단락이 하나씩 필요하므로, 시각 자료를 한 개, 두 개, 또는 세 개 그룹으로 나눠야 해요. 유형이나 주제가 같은 시각 자료는 함께 묶고, 다른 기준을 측정하는 시각 자료는 따로 단락을 만드세요. 쓰기 전에 나누는 방법을 정하세요. 그것이 보고서 전체의 순서를 결정하기 때문이에요.
개요
개요는 모든 시각 자료에 걸친 가장 큰 패턴을 한두 문장으로 밝혀요. 각 시각 자료의 주요 움직임을 찾은 다음, 한 자료가 다른 자료를 뒷받침하거나 설명하는지 판단하세요. 정확한 수치와 개별 범주는 본론 단락에 써요.
쓰기
보고서는 짧은 단계로 나누어 써요. 서론은 과제를 패러프레이즈하고, 개요는 주요 패턴을 밝히고, 본론 단락은 그룹마다 하나씩 설명해요. 본론 단락에서는 함께 묶이는 비교끼리 모으고, 모든 숫자를 나열하는 대신 고른 수치 몇 개로 각 비교를 뒷받침하세요.
IELTS 학술 라이팅 Task 1 혼합 데이터에 대처하는 방법을 배우려면, 7일 무료 체험에 가입하여 IELTS 학술 라이팅 Task - 혼합 데이터 레슨에 액세스하세요.
7일 무료 체험IELTS 학술 라이팅 Task 1을 위한 어휘
이 과제에서 높은 점수를 얻으려면, 원형/막대/선/혼합 그래프에 주어진 데이터를 제시하기 위해 적절한 단어와 구문을 사용하는 방법을 배워야 합니다. 7일 무료 체험에 가입하고 다음 레슨을 완료하시는 것을 추천합니다:
- IELTS 학술 라이팅 Task 1 레슨 - 숫자에 대해 작성하는 방법
- IELTS 학술 라이팅 Task 1 레슨 - 백분율에 대해 작성하는 방법
- IELTS 학술 라이팅 Task 1 레슨 - 데이터의 변화에 대해 작성하는 방법
IELTS 라이팅 Task 1 샘플
이 섹션은 IELTS 학술 라이팅 Task 1을 위한 IELTS 라이팅 샘플 목록을 제시합니다.
IELTS 일반 라이팅 Task 1
IELTS 일반 트레이닝 라이팅 task 1에서는, 한 상황이 제시되며 최소 150단어의 비공식, 세미 공식 또는 공식 편지 형태로 개인적인 응답을 작성하셔야 합니다. 작성하라고 요청받는 상황은 다음과 같은 일반적이고 일상적인 것들입니다:
- 대학 숙소 담당자에게 숙소 문제에 대해 작성,
- 새로운 고용주에게 그들이 겪고 있는 시간 관리 문제에 대해 작성,
- 지역 신문에 지역 공항 개발 계획에 대해 작성,
- 임대 회사에 그들의 집 난방 시스템 문제를 해결하기 위해 작성.
상황과 관련하여, 응답에 포함해야 하는 세 개의 글머리 기호 형태의 정보가 주어집니다. 정보를 요청하거나 제공하고/또는 상황을 설명해야 할 수 있습니다. 이를 위해 다음 중 일부를 해야 할 수도 있습니다:
- 일반적인 사실 정보를 요청하고/또는 제공하기,
- 필요, 욕구, 좋아함 또는 싫어함을 표현하기,
- 의견이나 불만을 표현하기,
- 요청을 하거나 제안/추천하기.
IELTS 일반 라이팅 스타일
사용할 라이팅 스타일은 당신이 누구에게 글을 쓰도록 요청받았는지(즉, 청중) 그리고 그들을 얼마나 잘 알고 있어야 하는지에 따라 다릅니다. 청중에게 적합하고 글쓰기 목적을 달성하는 데 도움이 되는 스타일로 작성해야 합니다. 예: 친구에게 글쓰기(비공식) 또는 매니저에게 글쓰기(세미 공식 또는 공식). 편지 머리에 주소를 포함할 필요는 없습니다.
IELTS 일반 라이팅 Task 1에서 점수를 잃지 않는 방법
언급한 대로, 이 과제에 20분 이상을 사용하지 말고 최소 150단어를 작성해야 합니다. 그렇지 않으면 페널티를 받습니다. 150단어 이상을 작성한다고 페널티는 없지만, task 1 답안이 길어지면 라이팅 밴드 점수에 두 배 기여하는 task 2에 쓸 시간이 적어진다는 점을 기억하셔야 합니다.
또한 응답이 주제에서 벗어나거나 완전한 연결 텍스트로 작성되지 않은 경우(예: 응답의 어느 부분에서 글머리 기호 사용, 또는 메모 형식 등) 무관련성에 대해 페널티를 받는다는 점을 기억해야 합니다. 표절(즉, 다른 출처에서 복사)에 대해서는 엄격한 페널티를 받습니다.
Last weekend, your cousin celebrated her 50th birthday, but you couldn't attend and you forgot to cancel.
Write a letter to your cousin. In your letter:
- Apologize for missing the birthday celebration
- Explain why you missed it and why you hadn't let her know
- Describe how you will make it up to her
You do NOT need to write any addresses.
Begin your letter as follows:
Dear ___,
- Write at least 150 words.
- You should spend around 20 minutes on this task.
Dear Marnie,
Happy belated birthday! I hope you're doing well and that you had a great 50th birthday party.
I'm so sorry that I wasn't at your party to celebrate with you. It's been such a long time since we've been able to catch up and see each other.
To be completely honest, I've been swamped with work lately, and I was asked to go on a last-minute business trip a few days before your birthday. I was so busy that I had completely forgotten about your party, and it didn't occur to me to call you and cancel.
My busy schedule is absolutely not an excuse for missing your 50th birthday, though, and I would love to make it up to you. I've reserved a table for two next Friday night at the new sushi restaurant in town. Can I please treat you to a luxurious birthday dinner?
I hope we can celebrate together next Friday!
Speak to you soon,
Jessica
Total Word Count: 162 words

Task Achievement — Letter
Learn how to answer this question in a step-by-step interactive exercise
Task Achievement — Letter
IELTS General Training Task 1에서는 주어진 상황에 대응하는 편지를 써요. 과제 달성도는 과제에 제시된 항목을 모두 다루는지에 달려 있어요. 잘 쓴 편지라도 항목 하나를 빠뜨리면 점수가 깎이거든요.
상황, 제시된 항목, 그리고 과제가 주는 첫 문장이 있다면 그것까지 읽으세요.
과제를 미리 보고 다음을 클릭해 계속하세요.
문제 미리 보기
Write a letter to your cousin. In your letter:
- Apologize for missing the birthday celebration
- Explain why you missed it and why you hadn't let her know
- Describe how you will make it up to her
Write at least 150 words. You do NOT need to write any addresses.
Begin your letter as follows:
Dear ___,
쓰기 전에 세 가지 질문에 답하며 편지를 계획하세요. 누구에게 쓰는지, 왜 쓰는지, 편지에 무엇이 들어가야 하는지예요.
받는 사람은 언어를 얼마나 격식 있게 쓸지 정하고, 목적은 편지를 어떻게 시작할지 정하고, 제시된 항목은 내용을 정해요. 모든 답은 이미 과제 어딘가에 있어요.
각 계획 질문을 그 답이 들어 있는 과제의 부분과 연결하세요.
과제 이해하기
각 계획 질문을 그 답이 들어 있는 과제의 부분과 연결하세요.
첫인사와 끝인사는 편지가 얼마나 격식 있는지 읽는 사람에게 알려 주므로, 받는 사람에게 맞아야 해요. 모르는 사람이나 관리자에게 쓰는 편지는 격식체이고, 친구에게 쓰는 편지는 비격식체예요.
편지의 처음과 끝은 같은 수준으로 맞추세요. 격식 있는 첫인사 뒤에 가벼운 끝인사가 오면 읽는 사람이 헷갈려요.
받는 사람에게 맞는 첫인사와 끝인사를 고르세요.
첫인사와 끝인사 고르기
Confirm the greeting
- Dear ___,
- Dear Sir or Madam,
- Dear Ms. Smith,
- Hey you,
Choose a closing
- Speak to you soon,
- Lots of love,
- Best wishes,
- Yours faithfully,
- Yours sincerely,
첫 번째 항목에는 단락을 따로 하나 쓰세요. 과제 달성도는 각 항목을 언급만 했는지가 아니라 다루고 전개했는지로 판단해요.
문장을 시작할 수 있도록 문장 시작 표현이 주어져요. 나머지 생각은 자신의 말로 마무리하고, 어조는 첫인사와 같게 유지하세요.
첫 번째 항목을 다루는 단락을 쓰세요.
제시된 항목 1 쓰기
Apologise for missing the birthday celebration
두 번째 항목에도 단락을 따로 하나 쓰세요. 반만 답한 항목도 점수가 깎이므로, 첫 번째 단락과 같은 길이와 같은 수준의 세부 내용으로 쓰세요.
문장 시작 표현으로 시작한 다음, 이 상황에서 받는 사람에게 실제로 필요한 세부 내용을 더하세요.
두 번째 항목을 다루는 단락을 쓰세요.
제시된 항목 2 쓰기
Explain why you missed it and did not let her know
세 번째 항목으로 편지 본문을 마무리하세요. 세 항목을 모두 완전한 문장으로 다루면 과제가 완성돼요.
끝까지 어조를 일관되게 유지하고, 이 단락이 항목에서 실제로 요구한 것에 답하는지 확인하세요.
세 번째 항목을 다루는 단락을 쓰세요.
제시된 항목 3 쓰기
Describe how you will make it up to her
이제 첫인사와 끝인사까지 갖춰져, 내 단락들이 하나의 편지로 함께 보여요. 한 편의 글로 읽으며 모든 항목이 다뤄졌는지 확인하세요.
내 표현을 샘플 편지와 비교하고, 첫인사부터 끝인사까지 어조가 어떻게 똑같이 유지되는지 살펴보세요.
편지를 검토한 뒤 다음을 클릭해 계속하세요.
완성한 편지 다시 보기
판단 방법
Task 1 편지는 주어진 상황에 대응하며 제시된 항목들을 다뤄요. 과제 달성도는 제시된 항목을 모두 다루고 읽는 사람에 맞는 어조를 쓰는지에 달려 있어요.
제시된 항목을 하나도 빠뜨리지 않고 격식의 수준이 처음부터 끝까지 같도록 정해진 순서대로 쓰세요.
- 과제 이해하기. 누구에게 쓰는지, 왜 쓰는지, 편지에 무엇이 들어가야 하는지 파악하세요.
- 첫인사와 끝인사 고르기. 첫인사와 끝인사를 읽는 사람에 맞추고, 둘의 격식 수준을 같게 유지하세요.
- 제시된 항목 쓰기. 제시된 항목마다 단락을 하나씩 주고, 실제적인 세부 내용으로 전개하세요.
- 완성한 편지 다시 보기. 단락들을 함께 읽고 제시된 항목을 모두 다뤘는지 확인하세요.
제시된 항목마다 단락을 하나씩 쓰세요. 이 간단한 계획을 따르면 항목을 빠뜨리기가 거의 불가능해요. 항목을 빠뜨리는 것이 과제 달성도 점수를 가장 빨리 잃는 길이에요.
계획
세 가지 질문으로 편지 전체를 계획할 수 있어요. 누구에게 쓰는지, 왜 쓰는지, 편지에 무엇이 들어가야 하는지예요. 각 질문의 답은 이미 문제 어딘가에 나와 있어요.
어조
첫인사와 끝인사는 편지가 얼마나 격식을 갖추었는지 읽는 사람에게 보여 줘요. 모르는 사람이나 관리자에게 쓰는 편지는 격식체, 친구에게 쓰는 편지는 비격식체이고, 편지의 처음과 끝은 같은 수준을 유지해야 해요.
제시된 항목
제시된 항목마다 단락을 하나씩 써요. 읽는 사람에게 실제로 필요한 세부 내용을 넣어 완전한 문장으로 다루고, 어느 요점도 서둘러 쓴 것처럼 보이지 않도록 단락 길이를 비슷하게 맞추세요.
IELTS 일반 라이팅 Task 1에 대한 자세한 정보는 IELTS 일반 라이팅 Task 1의 궁극의 가이드를 확인하세요.
IELTS 라이팅 Task 2
IELTS 라이팅 task 2에서는 질문에 대한 응답으로 전통적인 스타일의 에세이를 작성하셔야 합니다. 최소 250단어를 작성해야 합니다. 충분한 단어를 작성하지 않으면 페널티를 받습니다. task 2에는 6가지 다른 질문 유형이 있습니다. 각 에세이 유형에 대한 샘플 질문과 모델 에세이를 살펴보겠습니다.
원인과 결과
이 유형의 질문에서는 문제 또는 상황이 주어집니다. 당신의 과제는 상황의 원인과 상황의 일부 영향을 설명하는 것입니다.
It is observed that in many countries not enough students are choosing to study science at university. What are the causes? And what will be the effects on society?
- Write at least 250 words.
- You should spend around 40 minutes on this task.
It is a fact that many students globally are avoiding science in favor of other subjects at university. Such a trend is largely due to how science is perceived, which may be having a detrimental effect on a nation’s development.
The primary reason for the drop in enrollment in science-based courses is that many undergraduates are put off by their difficulty. While many high school students enjoy science, they soon find themselves facing a lot of theory and research based courses once in college. For example according to a recent poll of UK universities, many students stated that while science was interesting in high school, there was too much theory learnt in classes, and not enough application in the lab to make it interesting. Furthermore, there are plenty of easier alternatives such as humanities for students to choose from these days. As a result, most choose a more appealing humanities degree over a science one.
Countries with the lowest science enrollment rates are affected the most competitively and economically. Fewer science graduates mean a shortage of skilled researchers in science-related fields like bio-engineering which reduces a countries competitiveness in attracting foreign investment. In other words foreign companies are usually unwilling to invest in nations with a low pool of skilled workers. In addition, a low number of skilled workers mean fewer technological developments for such countries, which may cause their economies to suffer from lost business in being the first to market with new products. For example, evidence shows that the number of patents filed by Chinese corporations is beginning to threaten the number credited to American ones.
In conclusion, there is a direct correlation between the perceived difficulty of science degrees and limited economic growth. Only by changing this attitude will countries reverse this trend.
Task Achievement — Task 2
Learn how to answer this question in a step-by-step interactive exercise
Task Achievement — Task 2
IELTS Writing Task 2에서는 문제의 모든 부분에 답하는 에세이를 써요. 진술문과 지시문을 주의 깊게 읽고, 문제가 무엇을 논의하라고 하는지 확인하세요.
주제에서 벗어나지 않더라도 실제로 묻는 질문에 답하지 않는 에세이는 높은 밴드를 받을 수 없어요.
문제를 미리 보고 다음을 클릭해 계속하세요.
문제 미리 보기
서론을 두 문장, 모두 합쳐 25~35단어 정도로 써 봐요. 먼저 문제를 자신의 말로 다시 쓰세요. 자신의 표현과 동의어를 써서 문제를 패러프레이즈하세요. 그러면 에세이가 주제에서 벗어나지 않고, 폭넓은 어휘력도 보여 줄 수 있어요. 두 번째 문장에서는 본론 단락에서 논의할 구체적인 주제를 소개해요.
서론을 쓰세요.
서론 쓰기
각 본론 단락에는 요점을 소개하는 주제문이 필요해요. 이 길이의 에세이라면 본론 단락은 두 개면 충분해요.
단락마다 분명한 문장을 하나씩 쓰세요. 각 문장은 12~20단어로 쓰고, 설명과 예시는 다음 단계를 위해 남겨 두세요.
본론 단락마다 주제문을 하나씩 쓰세요.
주제문 두 개 쓰기
science courses are seen as too hard
fewer scientists hurt the economy
주제문은 뒷받침될 때만 점수를 받아요. 첫 번째 본론 단락을 두 가지 요점으로 전개하세요. 요점마다 설명과 구체적인 예시를 쓰세요.
각 본론 단락은 4~5문장, 즉 60~80단어 정도가 되어야 해요. 일반적인 진술보다 구체적인 상황이 더 설득력 있어요.
첫 번째 본론 단락의 나머지를 쓰세요.
본론 단락 1 전개하기
60
두 번째 본론 단락도 첫 번째만큼 깊이 있게 쓰세요. 두 가지 요점을 쓰고, 각각을 설명과 예시로 뒷받침하세요.
각 본론 단락은 4~5문장, 즉 60~80단어 정도가 되어야 해요. 첫 번째 단락을 표현만 바꿔 되풀이하지 마세요.
두 번째 본론 단락의 나머지를 쓰세요.
본론 단락 2 전개하기
60
결론은 에세이를 마무리해요. 요점을 두 문장으로 요약한 다음, 이 주제가 왜 중요한지 한두 문장을 더하세요.
서론을 베끼지 말고, 새로운 주장을 더하지 마세요. 결론 전체는 35~50단어로 쓰세요.
결론을 3~4문장으로 쓰세요.
결론 쓰기
35
이제 서론, 주제문, 본론 단락, 결론이 하나의 에세이로 함께 보여요. 한 편의 글로 읽으며 문제의 모든 부분에 답하는지 확인하세요.
내 표현을 샘플 에세이와 비교하고, 각 단락이 서로 다른 역할을 어떻게 하는지 살펴보세요.
에세이를 검토한 뒤 다음을 클릭해 계속하세요.
완성한 에세이 다시 보기
판단 방법
Task 2 에세이는 질문의 모든 부분에 답해요. 과제 달성도는 질문이 요구하는 것을 다루고, 각 요점을 설명과 예시로 뒷받침하는지에 달려 있어요.
서론, 주제문 두 개, 충분히 전개한 본론 단락 두 개, 그리고 결론의 정해진 순서대로 쓰세요.
- 서론 쓰기.
일반적으로 이 단락에는 두 문장이 필요해요. 자신의 말과 동의어를 써서 질문을 패러프레이즈하세요. 그러면 에세이가 주제에서 벗어나지 않고, 다양한 어휘를 보여 줄 수 있어요. 두 번째 문장은 본론 단락에서 다룰 구체적인 주제를 소개해요. 따라서 서론에는 다음이 들어가야 해요.
- 다시 쓴 질문
- 구체적인 주제 소개
- 주제문 두 개 쓰기. 본론 단락마다 주제문을 하나씩 쓰세요.
- 본론 단락 전개하기. 각 본론 단락을 두 가지 요점으로 뒷받침하고, 요점마다 설명과 예시를 하나씩 붙이세요. 본론 단락 하나는 4–5문장 정도가 좋아요.
- 결론 쓰기. 요점을 요약한 다음, 그 주제가 왜 중요한지 말하세요.
- 완성한 에세이 다시 보기. 각 부분을 함께 읽고 질문의 모든 부분에 답했는지 확인하세요.
충분히 전개한 단락 두 개가 전개하지 않은 요점 네 개보다 점수가 높아요. 시험관은 뒷받침에 점수를 주므로, 요점을 하나 더 추가하기보다 이미 있는 요점에 설명과 예시를 더하세요.
서론
일반적으로 이 단락에는 두 문장이 필요해요. 자신의 말과 동의어를 써서 질문을 패러프레이즈하세요. 그러면 에세이가 주제에서 벗어나지 않고, 다양한 어휘를 보여 줄 수 있어요. 두 번째 문장은 본론 단락에서 다룰 구체적인 주제를 소개해요. 따라서 서론에는 다음이 들어가야 해요.
- 다시 쓴 질문
- 구체적인 주제 소개
주제문
본론 단락마다 주제문을 하나씩 쓰세요. 각 문장은 그 단락의 요점을 12~20단어로 소개하고, 예시는 다음 단계를 위해 남겨 두세요.
뒷받침
주제문은 뒷받침이 있어야 점수를 받아요. 요점이 왜 맞는지 설명하고, 구체적인 예시를 들고, 두 본론 단락을 같은 정도로 뒷받침하세요. 본론 단락 하나는 4–5문장 정도가 좋아요.
결론
결론은 요점을 두 문장으로 요약한 다음, 그 주제가 왜 중요한지 한두 문장을 덧붙여요. 서론을 그대로 베끼지 말고, 새로운 주장을 더하지 마세요.
양쪽 견해를 모두 논의하고 자신의 의견 제시
이 유형의 질문에서는 이슈와 관련된 두 가지 반대되는 견해가 주어집니다. 일반적으로 두 견해는 별도의 문장에 있으며 두 견해가 대조됨을 나타내기 위해 "however"와 같은 전환어로 연결됩니다. 당신의 과제는 논설문을 작성하는 것입니다. 이슈의 양쪽을 대조하고 자신의 견해를 제시하는 것입니다.
Some people argue that the public should be allowed to have guns. Others do not agree. Discuss both points of view and give your opinion.
- Write at least 250 words.
- You should spend around 40 minutes on this task.
Gun ownership is a controversial topic with some people arguing that the public should have the choice to own them, while others disagree wholeheartedly with the idea. In my opinion, I believe that the public should only be entitled to own guns after having proper training.
The benefits of gun ownership are touted in some countries more than others. In countries where owning one is a civic right, like the United States, it is legal to use one in self-defense is legal. With muggings, murder and burglary rising in many countries, there may be some truth to the claim that owing a gun gives the owner increased security. Furthermore, in remote or dangerous areas, guns may be a necessity rather than an option. Without police nearby, properly stored, guns may be a great asset in deterring criminals from breaking and entering a remote property.
However, rather than deter violence, guns tend to escalate it in areas where they are widely available. Research shows that violent crime increases dramatically when guns are prevalent in society. When the public is armed, criminals and the police become so too, creating a situation in which guns beget more guns and eventually death. Additionally, greater ease of access is dangerous for children. Having a gun easily accessible may tempt children to abuse them as evidenced by the almost weekly school shootings in the US. There is further a proven link between increased suicide rates when guns are present.
It is my belief that the general public should be barred from owning guns of any kind. Also, guns should be restricted to specialists with a proven need for a firearm such as soldiers or hunters. While there are certain circumstances where owning a gun is an advantage, in the vast majority of situations there is no place for a gun in modern society.
Task Achievement — Task 2
Learn how to answer this question in a step-by-step interactive exercise
Task Achievement — Task 2
IELTS Writing Task 2에서는 문제의 모든 부분에 답하는 에세이를 써요. 진술문과 지시문을 주의 깊게 읽고, 문제가 무엇을 논의하라고 하는지 확인하세요.
주제에서 벗어나지 않더라도 실제로 묻는 질문에 답하지 않는 에세이는 높은 밴드를 받을 수 없어요.
문제를 미리 보고 다음을 클릭해 계속하세요.
문제 미리 보기
서론을 두 문장, 모두 합쳐 25~35단어 정도로 써 봐요. 먼저 문제를 자신의 말로 다시 쓰세요. 자신의 표현과 동의어를 써서 문제를 패러프레이즈하세요. 그러면 에세이가 주제에서 벗어나지 않고, 폭넓은 어휘력도 보여 줄 수 있어요. 두 번째 문장에서는 본론 단락에서 논의할 구체적인 주제를 소개해요.
서론을 쓰세요.
서론 쓰기
각 본론 단락에는 요점을 소개하는 주제문이 필요해요. 이 길이의 에세이라면 본론 단락은 두 개면 충분해요.
단락마다 분명한 문장을 하나씩 쓰세요. 각 문장은 12~20단어로 쓰고, 설명과 예시는 다음 단계를 위해 남겨 두세요.
본론 단락마다 주제문을 하나씩 쓰세요.
주제문 두 개 쓰기
guns help people defend themselves
more guns lead to more violence
주제문은 뒷받침될 때만 점수를 받아요. 첫 번째 본론 단락을 두 가지 요점으로 전개하세요. 요점마다 설명과 구체적인 예시를 쓰세요.
각 본론 단락은 4~5문장, 즉 60~80단어 정도가 되어야 해요. 일반적인 진술보다 구체적인 상황이 더 설득력 있어요.
첫 번째 본론 단락의 나머지를 쓰세요.
본론 단락 1 전개하기
60
두 번째 본론 단락도 첫 번째만큼 깊이 있게 쓰세요. 두 가지 요점을 쓰고, 각각을 설명과 예시로 뒷받침하세요.
각 본론 단락은 4~5문장, 즉 60~80단어 정도가 되어야 해요. 첫 번째 단락을 표현만 바꿔 되풀이하지 마세요.
두 번째 본론 단락의 나머지를 쓰세요.
본론 단락 2 전개하기
60
결론은 에세이를 마무리해요. 요점을 두 문장으로 요약한 다음, 이 주제가 왜 중요한지 한두 문장을 더하세요.
서론을 베끼지 말고, 새로운 주장을 더하지 마세요. 결론 전체는 35~50단어로 쓰세요.
결론을 3~4문장으로 쓰세요.
결론 쓰기
35
이제 서론, 주제문, 본론 단락, 결론이 하나의 에세이로 함께 보여요. 한 편의 글로 읽으며 문제의 모든 부분에 답하는지 확인하세요.
내 표현을 샘플 에세이와 비교하고, 각 단락이 서로 다른 역할을 어떻게 하는지 살펴보세요.
에세이를 검토한 뒤 다음을 클릭해 계속하세요.
완성한 에세이 다시 보기
판단 방법
Task 2 에세이는 질문의 모든 부분에 답해요. 과제 달성도는 질문이 요구하는 것을 다루고, 각 요점을 설명과 예시로 뒷받침하는지에 달려 있어요.
서론, 주제문 두 개, 충분히 전개한 본론 단락 두 개, 그리고 결론의 정해진 순서대로 쓰세요.
- 서론 쓰기.
일반적으로 이 단락에는 두 문장이 필요해요. 자신의 말과 동의어를 써서 질문을 패러프레이즈하세요. 그러면 에세이가 주제에서 벗어나지 않고, 다양한 어휘를 보여 줄 수 있어요. 두 번째 문장은 본론 단락에서 다룰 구체적인 주제를 소개해요. 따라서 서론에는 다음이 들어가야 해요.
- 다시 쓴 질문
- 구체적인 주제 소개
- 주제문 두 개 쓰기. 본론 단락마다 주제문을 하나씩 쓰세요.
- 본론 단락 전개하기. 각 본론 단락을 두 가지 요점으로 뒷받침하고, 요점마다 설명과 예시를 하나씩 붙이세요. 본론 단락 하나는 4–5문장 정도가 좋아요.
- 결론 쓰기. 요점을 요약한 다음, 그 주제가 왜 중요한지 말하세요.
- 완성한 에세이 다시 보기. 각 부분을 함께 읽고 질문의 모든 부분에 답했는지 확인하세요.
충분히 전개한 단락 두 개가 전개하지 않은 요점 네 개보다 점수가 높아요. 시험관은 뒷받침에 점수를 주므로, 요점을 하나 더 추가하기보다 이미 있는 요점에 설명과 예시를 더하세요.
서론
일반적으로 이 단락에는 두 문장이 필요해요. 자신의 말과 동의어를 써서 질문을 패러프레이즈하세요. 그러면 에세이가 주제에서 벗어나지 않고, 다양한 어휘를 보여 줄 수 있어요. 두 번째 문장은 본론 단락에서 다룰 구체적인 주제를 소개해요. 따라서 서론에는 다음이 들어가야 해요.
- 다시 쓴 질문
- 구체적인 주제 소개
주제문
본론 단락마다 주제문을 하나씩 쓰세요. 각 문장은 그 단락의 요점을 12~20단어로 소개하고, 예시는 다음 단계를 위해 남겨 두세요.
뒷받침
주제문은 뒷받침이 있어야 점수를 받아요. 요점이 왜 맞는지 설명하고, 구체적인 예시를 들고, 두 본론 단락을 같은 정도로 뒷받침하세요. 본론 단락 하나는 4–5문장 정도가 좋아요.
결론
결론은 요점을 두 문장으로 요약한 다음, 그 주제가 왜 중요한지 한두 문장을 덧붙여요. 서론을 그대로 베끼지 말고, 새로운 주장을 더하지 마세요.
장점 및 단점
이 유형의 질문에서는 상황, 해결책 또는 추세의 긍정적 및 부정적 측면을 논의하라는 요청을 받습니다. 또한 어느 쪽이 더 중요하다고 생각하는지에 대한 의견을 제시하라는 요청을 받을 수도 있습니다.
In some countries, governments are encouraging industries and businesses to move to regional areas outside the big cities. Do the advantages of this trend outweigh the disadvantages?
- Write at least 250 words.
- You should spend around 40 minutes on this task.
There is a movement among some countries to promote regional areas away from cities as attractive to business and industry. In my opinion, I consider relocation of business to bring about more drawbacks than benefits over the long term.
There are several attractive benefits to businesses moving to regional areas. For businesses rural locations mean lower land prices. Cheaper land allows large or small business equal prospects to become established cheaply with additional room to expand. As an example, the average size of a business in UK cities is currently 25 square meters while those in the rural locales average around 50m2. Additionally, countries benefits principally from the direct investment in underperforming parts of the country. Having companies operating in less urbanized areas, creates jobs, attracts talent and increases immigration which brings greater wealth.
On the other hand, relocation is not without its drawbacks. For one thing, locations away from population centers may mean a greater distance to market for goods. As a result, cost savings from cheaper land may be mitigated by the increased transportation costs of shipping products to customers. For another thing, there are often fewer skilled workers in regional areas. It may not be easy to attract employees to work in out-of-the-way places, which would mean longer commutes for staff from nearby cities at the expense of the company coffers. Lastly, increased business in country areas, disturbs the life of local residents. Country roads are not built for heavy trucks or traffic which may cause increased noise, congestions and inconvenience to those living nearby.
To sum up, while regional settings may be well suited to certain internet-based businesses, for more traditional companies, the distance from the city presents many challenges to overcome.
Task Achievement — Task 2
Learn how to answer this question in a step-by-step interactive exercise
Task Achievement — Task 2
IELTS Writing Task 2에서는 문제의 모든 부분에 답하는 에세이를 써요. 진술문과 지시문을 주의 깊게 읽고, 문제가 무엇을 논의하라고 하는지 확인하세요.
주제에서 벗어나지 않더라도 실제로 묻는 질문에 답하지 않는 에세이는 높은 밴드를 받을 수 없어요.
문제를 미리 보고 다음을 클릭해 계속하세요.
문제 미리 보기
서론을 두 문장, 모두 합쳐 25~35단어 정도로 써 봐요. 먼저 문제를 자신의 말로 다시 쓰세요. 자신의 표현과 동의어를 써서 문제를 패러프레이즈하세요. 그러면 에세이가 주제에서 벗어나지 않고, 폭넓은 어휘력도 보여 줄 수 있어요. 두 번째 문장에서는 본론 단락에서 논의할 구체적인 주제를 소개해요.
서론을 쓰세요.
서론 쓰기
각 본론 단락에는 요점을 소개하는 주제문이 필요해요. 이 길이의 에세이라면 본론 단락은 두 개면 충분해요.
단락마다 분명한 문장을 하나씩 쓰세요. 각 문장은 12~20단어로 쓰고, 설명과 예시는 다음 단계를 위해 남겨 두세요.
본론 단락마다 주제문을 하나씩 쓰세요.
주제문 두 개 쓰기
cheaper land and new jobs in the regions
higher transport costs and fewer skilled workers
주제문은 뒷받침될 때만 점수를 받아요. 첫 번째 본론 단락을 두 가지 요점으로 전개하세요. 요점마다 설명과 구체적인 예시를 쓰세요.
각 본론 단락은 4~5문장, 즉 60~80단어 정도가 되어야 해요. 일반적인 진술보다 구체적인 상황이 더 설득력 있어요.
첫 번째 본론 단락의 나머지를 쓰세요.
본론 단락 1 전개하기
60
두 번째 본론 단락도 첫 번째만큼 깊이 있게 쓰세요. 두 가지 요점을 쓰고, 각각을 설명과 예시로 뒷받침하세요.
각 본론 단락은 4~5문장, 즉 60~80단어 정도가 되어야 해요. 첫 번째 단락을 표현만 바꿔 되풀이하지 마세요.
두 번째 본론 단락의 나머지를 쓰세요.
본론 단락 2 전개하기
60
결론은 에세이를 마무리해요. 요점을 두 문장으로 요약한 다음, 이 주제가 왜 중요한지 한두 문장을 더하세요.
서론을 베끼지 말고, 새로운 주장을 더하지 마세요. 결론 전체는 35~50단어로 쓰세요.
결론을 3~4문장으로 쓰세요.
결론 쓰기
35
이제 서론, 주제문, 본론 단락, 결론이 하나의 에세이로 함께 보여요. 한 편의 글로 읽으며 문제의 모든 부분에 답하는지 확인하세요.
내 표현을 샘플 에세이와 비교하고, 각 단락이 서로 다른 역할을 어떻게 하는지 살펴보세요.
에세이를 검토한 뒤 다음을 클릭해 계속하세요.
완성한 에세이 다시 보기
판단 방법
Task 2 에세이는 질문의 모든 부분에 답해요. 과제 달성도는 질문이 요구하는 것을 다루고, 각 요점을 설명과 예시로 뒷받침하는지에 달려 있어요.
서론, 주제문 두 개, 충분히 전개한 본론 단락 두 개, 그리고 결론의 정해진 순서대로 쓰세요.
- 서론 쓰기.
일반적으로 이 단락에는 두 문장이 필요해요. 자신의 말과 동의어를 써서 질문을 패러프레이즈하세요. 그러면 에세이가 주제에서 벗어나지 않고, 다양한 어휘를 보여 줄 수 있어요. 두 번째 문장은 본론 단락에서 다룰 구체적인 주제를 소개해요. 따라서 서론에는 다음이 들어가야 해요.
- 다시 쓴 질문
- 구체적인 주제 소개
- 주제문 두 개 쓰기. 본론 단락마다 주제문을 하나씩 쓰세요.
- 본론 단락 전개하기. 각 본론 단락을 두 가지 요점으로 뒷받침하고, 요점마다 설명과 예시를 하나씩 붙이세요. 본론 단락 하나는 4–5문장 정도가 좋아요.
- 결론 쓰기. 요점을 요약한 다음, 그 주제가 왜 중요한지 말하세요.
- 완성한 에세이 다시 보기. 각 부분을 함께 읽고 질문의 모든 부분에 답했는지 확인하세요.
충분히 전개한 단락 두 개가 전개하지 않은 요점 네 개보다 점수가 높아요. 시험관은 뒷받침에 점수를 주므로, 요점을 하나 더 추가하기보다 이미 있는 요점에 설명과 예시를 더하세요.
서론
일반적으로 이 단락에는 두 문장이 필요해요. 자신의 말과 동의어를 써서 질문을 패러프레이즈하세요. 그러면 에세이가 주제에서 벗어나지 않고, 다양한 어휘를 보여 줄 수 있어요. 두 번째 문장은 본론 단락에서 다룰 구체적인 주제를 소개해요. 따라서 서론에는 다음이 들어가야 해요.
- 다시 쓴 질문
- 구체적인 주제 소개
주제문
본론 단락마다 주제문을 하나씩 쓰세요. 각 문장은 그 단락의 요점을 12~20단어로 소개하고, 예시는 다음 단계를 위해 남겨 두세요.
뒷받침
주제문은 뒷받침이 있어야 점수를 받아요. 요점이 왜 맞는지 설명하고, 구체적인 예시를 들고, 두 본론 단락을 같은 정도로 뒷받침하세요. 본론 단락 하나는 4–5문장 정도가 좋아요.
결론
결론은 요점을 두 문장으로 요약한 다음, 그 주제가 왜 중요한지 한두 문장을 덧붙여요. 서론을 그대로 베끼지 말고, 새로운 주장을 더하지 마세요.
문제와 해결책
이 유형의 질문에서는 문제 또는 상황이 주어집니다. 당신의 과제는 상황의 원인과 문제의 일부 해결책을 설명하는 것입니다. 질문은 일반적인 해결책을 요청할 수 있고(예: 이 문제는 어떻게 해결될 수 있습니까) 특정 그룹이 문제를 어떻게 해결할 수 있는지 물을 수 있습니다(예: 정부와 개인이 문제를 해결하기 위해 어떤 조치를 취할 수 있습니까?). 영향을 자세히 언급할 필요는 없고 간단히 언급하면 됩니다.
More and more wild animals are on the verge of extinction and others are on the endangered list. What are the reasons for this? What can be done to solve this problem?
- Write at least 250 words.
- You should spend around 40 minutes on this task.
The number of critically endangered animals is growing significantly, while a disturbing number of other species have become threatened. This worrying trend stems from several causes, though solutions exist where the will to implement them is present.
Regarding species on the critically endangered list, outmoded beliefs in Eastern medicine that endangered animal parts have medicinal qualities is driving demand for them, particularly in China. Animals are needlessly killed to cure ailments from infertility to arthritis, and China’s increasing affluence mean demand is expected to increase even further. Despite this, limited action by governments has proven ineffective at stopping such a trade. Many species threatened with extinction live in national parks, typically in developing countries. However, chronic underfunding means officials there are powerless to catch poachers, and corruption means the ones who are caught, often get away.
Where political will is available, several solutions may help. To begin with, developed countries could help fund budgets to protect endangered species in poorer countries. While this doesn’t solve the issue of corruption, it would increase deterrence and hopefully reduce the number of animals needlessly killed. More meaningfully, in countries where animal parts are bought and sold, laws should be more strictly enforced and punishments massively increased to discourage both sellers and buyers alike. A concerted education campaign should also be effected to stamp out the perception that animal parts have any curative properties to reduce the market for such ‘goods’ once and for all.
In conclusion, removing the market for animal parts, and better protecting the endangered animals that remain may help preserve the world’s natural heritage before it is too late.
Further reasons to consider:
Development destroying their habitat and food sourceGrowing cities and farmland encroach on habitatMany animals cannot find the place to raise their youngFurther solutions to consider:
Increase government budgets to protect animalsFor example, the panda is now rebounding in Southern China due to concerted government efforts to protect it.Task Achievement — Task 2
Learn how to answer this question in a step-by-step interactive exercise
Task Achievement — Task 2
IELTS Writing Task 2에서는 문제의 모든 부분에 답하는 에세이를 써요. 진술문과 지시문을 주의 깊게 읽고, 문제가 무엇을 논의하라고 하는지 확인하세요.
주제에서 벗어나지 않더라도 실제로 묻는 질문에 답하지 않는 에세이는 높은 밴드를 받을 수 없어요.
문제를 미리 보고 다음을 클릭해 계속하세요.
문제 미리 보기
서론을 두 문장, 모두 합쳐 25~35단어 정도로 써 봐요. 먼저 문제를 자신의 말로 다시 쓰세요. 자신의 표현과 동의어를 써서 문제를 패러프레이즈하세요. 그러면 에세이가 주제에서 벗어나지 않고, 폭넓은 어휘력도 보여 줄 수 있어요. 두 번째 문장에서는 본론 단락에서 논의할 구체적인 주제를 소개해요.
서론을 쓰세요.
서론 쓰기
각 본론 단락에는 요점을 소개하는 주제문이 필요해요. 이 길이의 에세이라면 본론 단락은 두 개면 충분해요.
단락마다 분명한 문장을 하나씩 쓰세요. 각 문장은 12~20단어로 쓰고, 설명과 예시는 다음 단계를 위해 남겨 두세요.
본론 단락마다 주제문을 하나씩 쓰세요.
주제문 두 개 쓰기
animals are killed for traditional medicine
more funding, stricter laws and education
주제문은 뒷받침될 때만 점수를 받아요. 첫 번째 본론 단락을 두 가지 요점으로 전개하세요. 요점마다 설명과 구체적인 예시를 쓰세요.
각 본론 단락은 4~5문장, 즉 60~80단어 정도가 되어야 해요. 일반적인 진술보다 구체적인 상황이 더 설득력 있어요.
첫 번째 본론 단락의 나머지를 쓰세요.
본론 단락 1 전개하기
60
두 번째 본론 단락도 첫 번째만큼 깊이 있게 쓰세요. 두 가지 요점을 쓰고, 각각을 설명과 예시로 뒷받침하세요.
각 본론 단락은 4~5문장, 즉 60~80단어 정도가 되어야 해요. 첫 번째 단락을 표현만 바꿔 되풀이하지 마세요.
두 번째 본론 단락의 나머지를 쓰세요.
본론 단락 2 전개하기
60
결론은 에세이를 마무리해요. 요점을 두 문장으로 요약한 다음, 이 주제가 왜 중요한지 한두 문장을 더하세요.
서론을 베끼지 말고, 새로운 주장을 더하지 마세요. 결론 전체는 35~50단어로 쓰세요.
결론을 3~4문장으로 쓰세요.
결론 쓰기
35
이제 서론, 주제문, 본론 단락, 결론이 하나의 에세이로 함께 보여요. 한 편의 글로 읽으며 문제의 모든 부분에 답하는지 확인하세요.
내 표현을 샘플 에세이와 비교하고, 각 단락이 서로 다른 역할을 어떻게 하는지 살펴보세요.
에세이를 검토한 뒤 다음을 클릭해 계속하세요.
완성한 에세이 다시 보기
판단 방법
Task 2 에세이는 질문의 모든 부분에 답해요. 과제 달성도는 질문이 요구하는 것을 다루고, 각 요점을 설명과 예시로 뒷받침하는지에 달려 있어요.
서론, 주제문 두 개, 충분히 전개한 본론 단락 두 개, 그리고 결론의 정해진 순서대로 쓰세요.
- 서론 쓰기.
일반적으로 이 단락에는 두 문장이 필요해요. 자신의 말과 동의어를 써서 질문을 패러프레이즈하세요. 그러면 에세이가 주제에서 벗어나지 않고, 다양한 어휘를 보여 줄 수 있어요. 두 번째 문장은 본론 단락에서 다룰 구체적인 주제를 소개해요. 따라서 서론에는 다음이 들어가야 해요.
- 다시 쓴 질문
- 구체적인 주제 소개
- 주제문 두 개 쓰기. 본론 단락마다 주제문을 하나씩 쓰세요.
- 본론 단락 전개하기. 각 본론 단락을 두 가지 요점으로 뒷받침하고, 요점마다 설명과 예시를 하나씩 붙이세요. 본론 단락 하나는 4–5문장 정도가 좋아요.
- 결론 쓰기. 요점을 요약한 다음, 그 주제가 왜 중요한지 말하세요.
- 완성한 에세이 다시 보기. 각 부분을 함께 읽고 질문의 모든 부분에 답했는지 확인하세요.
충분히 전개한 단락 두 개가 전개하지 않은 요점 네 개보다 점수가 높아요. 시험관은 뒷받침에 점수를 주므로, 요점을 하나 더 추가하기보다 이미 있는 요점에 설명과 예시를 더하세요.
서론
일반적으로 이 단락에는 두 문장이 필요해요. 자신의 말과 동의어를 써서 질문을 패러프레이즈하세요. 그러면 에세이가 주제에서 벗어나지 않고, 다양한 어휘를 보여 줄 수 있어요. 두 번째 문장은 본론 단락에서 다룰 구체적인 주제를 소개해요. 따라서 서론에는 다음이 들어가야 해요.
- 다시 쓴 질문
- 구체적인 주제 소개
주제문
본론 단락마다 주제문을 하나씩 쓰세요. 각 문장은 그 단락의 요점을 12~20단어로 소개하고, 예시는 다음 단계를 위해 남겨 두세요.
뒷받침
주제문은 뒷받침이 있어야 점수를 받아요. 요점이 왜 맞는지 설명하고, 구체적인 예시를 들고, 두 본론 단락을 같은 정도로 뒷받침하세요. 본론 단락 하나는 4–5문장 정도가 좋아요.
결론
결론은 요점을 두 문장으로 요약한 다음, 그 주제가 왜 중요한지 한두 문장을 덧붙여요. 서론을 그대로 베끼지 말고, 새로운 주장을 더하지 마세요.
2부 구성 질문
이 유형의 질문에서는 두 가지 질문이 주어지고 둘 다 답해야 합니다. 두 질문은 다릅니다. 예를 들어, 아이디어나 행동의 중요성을 평가해야 할 수 있고 (예: 그것이 얼마나 중요합니까?), 동의하는지 동의하지 않는지 말해야 할 수도 있습니다(예: 동의하십니까 동의하지 않으십니까?).
News editors decide what to broadcast on television and what to print in newspapers. What factors do you think influence these decisions? Do you think that there is too much emphasis on bad news these days?
- Write at least 250 words.
- You should spend around 40 minutes on this task.
In the news business, editors have the final say in what makes it to air, or what makes it to print in newspapers. There are a variety of factors that affect their decision making; however, in my opinion, the public is inundated with negative news content, and more positive news would be beneficial to all.
Regarding news stories worth focusing on, editors must weigh up a number of aspects. For one thing, timing is a major factor in choosing stories to inform the public, especially ones that affect many people. Stories that happen right away are classified as newsworthy, however, if the same story happens again, it’s no longer interesting. For another, proximity to a story is important. Stories that happen closer to home become more newsworthy than those far away, so domestic news stories become more noteworthy than international ones. Finally, human interest stories always garner attention since they don’t date quickly, and often offer an emotion connection with the audience.
However, to my mind most news shared with the public is of a negative slant. Through TV, print and online media, society is inundated with stories of crime, disasters, and war to the point that the good news becomes exceptional. As a result, people have become accustomed to this trend and become more anxious about the state of the world. For this reason, I believe having a greater proportion of positive news in the media would benefit everyone. Stories of human interest, scientific discovery or human achievement help everyone understand the world around them, and make better decisions. That way, society can better understand the world rather than simply view it as a dangerous place.
In conclusion, although news editors face a lot of challenges in choosing newsworthy stories, I believe a more optimistic approach would add further value to the news profession.
Task Achievement — Task 2
Learn how to answer this question in a step-by-step interactive exercise
Task Achievement — Task 2
IELTS Writing Task 2에서는 문제의 모든 부분에 답하는 에세이를 써요. 진술문과 지시문을 주의 깊게 읽고, 문제가 무엇을 논의하라고 하는지 확인하세요.
주제에서 벗어나지 않더라도 실제로 묻는 질문에 답하지 않는 에세이는 높은 밴드를 받을 수 없어요.
문제를 미리 보고 다음을 클릭해 계속하세요.
문제 미리 보기
서론을 두 문장, 모두 합쳐 25~35단어 정도로 써 봐요. 먼저 문제를 자신의 말로 다시 쓰세요. 자신의 표현과 동의어를 써서 문제를 패러프레이즈하세요. 그러면 에세이가 주제에서 벗어나지 않고, 폭넓은 어휘력도 보여 줄 수 있어요. 두 번째 문장에서는 본론 단락에서 논의할 구체적인 주제를 소개해요.
서론을 쓰세요.
서론 쓰기
각 본론 단락에는 요점을 소개하는 주제문이 필요해요. 이 길이의 에세이라면 본론 단락은 두 개면 충분해요.
단락마다 분명한 문장을 하나씩 쓰세요. 각 문장은 12~20단어로 쓰고, 설명과 예시는 다음 단계를 위해 남겨 두세요.
본론 단락마다 주제문을 하나씩 쓰세요.
주제문 두 개 쓰기
timing, distance and human interest
too much bad news makes people anxious
주제문은 뒷받침될 때만 점수를 받아요. 첫 번째 본론 단락을 두 가지 요점으로 전개하세요. 요점마다 설명과 구체적인 예시를 쓰세요.
각 본론 단락은 4~5문장, 즉 60~80단어 정도가 되어야 해요. 일반적인 진술보다 구체적인 상황이 더 설득력 있어요.
첫 번째 본론 단락의 나머지를 쓰세요.
본론 단락 1 전개하기
60
두 번째 본론 단락도 첫 번째만큼 깊이 있게 쓰세요. 두 가지 요점을 쓰고, 각각을 설명과 예시로 뒷받침하세요.
각 본론 단락은 4~5문장, 즉 60~80단어 정도가 되어야 해요. 첫 번째 단락을 표현만 바꿔 되풀이하지 마세요.
두 번째 본론 단락의 나머지를 쓰세요.
본론 단락 2 전개하기
60
결론은 에세이를 마무리해요. 요점을 두 문장으로 요약한 다음, 이 주제가 왜 중요한지 한두 문장을 더하세요.
서론을 베끼지 말고, 새로운 주장을 더하지 마세요. 결론 전체는 35~50단어로 쓰세요.
결론을 3~4문장으로 쓰세요.
결론 쓰기
35
이제 서론, 주제문, 본론 단락, 결론이 하나의 에세이로 함께 보여요. 한 편의 글로 읽으며 문제의 모든 부분에 답하는지 확인하세요.
내 표현을 샘플 에세이와 비교하고, 각 단락이 서로 다른 역할을 어떻게 하는지 살펴보세요.
에세이를 검토한 뒤 다음을 클릭해 계속하세요.
완성한 에세이 다시 보기
판단 방법
Task 2 에세이는 질문의 모든 부분에 답해요. 과제 달성도는 질문이 요구하는 것을 다루고, 각 요점을 설명과 예시로 뒷받침하는지에 달려 있어요.
서론, 주제문 두 개, 충분히 전개한 본론 단락 두 개, 그리고 결론의 정해진 순서대로 쓰세요.
- 서론 쓰기.
일반적으로 이 단락에는 두 문장이 필요해요. 자신의 말과 동의어를 써서 질문을 패러프레이즈하세요. 그러면 에세이가 주제에서 벗어나지 않고, 다양한 어휘를 보여 줄 수 있어요. 두 번째 문장은 본론 단락에서 다룰 구체적인 주제를 소개해요. 따라서 서론에는 다음이 들어가야 해요.
- 다시 쓴 질문
- 구체적인 주제 소개
- 주제문 두 개 쓰기. 본론 단락마다 주제문을 하나씩 쓰세요.
- 본론 단락 전개하기. 각 본론 단락을 두 가지 요점으로 뒷받침하고, 요점마다 설명과 예시를 하나씩 붙이세요. 본론 단락 하나는 4–5문장 정도가 좋아요.
- 결론 쓰기. 요점을 요약한 다음, 그 주제가 왜 중요한지 말하세요.
- 완성한 에세이 다시 보기. 각 부분을 함께 읽고 질문의 모든 부분에 답했는지 확인하세요.
충분히 전개한 단락 두 개가 전개하지 않은 요점 네 개보다 점수가 높아요. 시험관은 뒷받침에 점수를 주므로, 요점을 하나 더 추가하기보다 이미 있는 요점에 설명과 예시를 더하세요.
서론
일반적으로 이 단락에는 두 문장이 필요해요. 자신의 말과 동의어를 써서 질문을 패러프레이즈하세요. 그러면 에세이가 주제에서 벗어나지 않고, 다양한 어휘를 보여 줄 수 있어요. 두 번째 문장은 본론 단락에서 다룰 구체적인 주제를 소개해요. 따라서 서론에는 다음이 들어가야 해요.
- 다시 쓴 질문
- 구체적인 주제 소개
주제문
본론 단락마다 주제문을 하나씩 쓰세요. 각 문장은 그 단락의 요점을 12~20단어로 소개하고, 예시는 다음 단계를 위해 남겨 두세요.
뒷받침
주제문은 뒷받침이 있어야 점수를 받아요. 요점이 왜 맞는지 설명하고, 구체적인 예시를 들고, 두 본론 단락을 같은 정도로 뒷받침하세요. 본론 단락 하나는 4–5문장 정도가 좋아요.
결론
결론은 요점을 두 문장으로 요약한 다음, 그 주제가 왜 중요한지 한두 문장을 덧붙여요. 서론을 그대로 베끼지 말고, 새로운 주장을 더하지 마세요.
의견
이 유형의 질문에서는 의견을 포함하는 질문이 주어집니다. 당신의 과제는 의견에 대한 응답으로 에세이를 작성하는 것입니다. 이 유형의 질문은 종종 의견에 동의하는지 동의하지 않는지를 묻습니다.
Some people are concerned that children spend too much time on computers – playing games, chatting and watching videos. But all this time is actually good preparation for children, who will have to spend many hours working on computers throughout their education and their working lives.To what extent do you agree or disagree with this statement?
- Write at least 250 words.
- You should spend around 40 minutes on this task.
With all the time that children spend engaged in various activities on computers, some people believe this is good preparation for a future in which many will work on computers full time through school and at work. I completely oppose this belief for several reasons.
To begin with, time on computers learning computer skills cannot be equated with that spent playing games or chatting online. While there may be some truth that videos games increase problem solving and analytical skills, there is no evidence to suggest that they improve other workplace skills. The skills children really need in a future work place are coding, designing, and software skills to name a few. The only way to ensure they learn these is for adults to be on hand to teach and supervise such learning.
Furthermore, spending too much time online may further have negative consequences to a child’s mental health. Unsupervised time on computers can result in children encountering inappropriate content online. Children have an extremely short attention span so are easily distracted by what they see or encounter online. There’s also the very real risk that children become addicted to the video games they play. Video game addiction is a proven disorder and affects many children in the US today. The quick-reward based system of such games is attractive and negatively affects how children learn and are motivated.
In conclusion, unless a child wishes to be a video game designer, increased computer time not only has little value to them beyond entertainment, it may even negatively affect a child’s development in the long term. Children should be supervised by adults when using computers to ensure they learn what they’re supposed to.
Task Achievement — Task 2
Learn how to answer this question in a step-by-step interactive exercise
Task Achievement — Task 2
IELTS Writing Task 2에서는 문제의 모든 부분에 답하는 에세이를 써요. 진술문과 지시문을 주의 깊게 읽고, 문제가 무엇을 논의하라고 하는지 확인하세요.
주제에서 벗어나지 않더라도 실제로 묻는 질문에 답하지 않는 에세이는 높은 밴드를 받을 수 없어요.
문제를 미리 보고 다음을 클릭해 계속하세요.
문제 미리 보기
서론을 두 문장, 모두 합쳐 25~35단어 정도로 써 봐요. 먼저 문제를 자신의 말로 다시 쓰세요. 자신의 표현과 동의어를 써서 문제를 패러프레이즈하세요. 그러면 에세이가 주제에서 벗어나지 않고, 폭넓은 어휘력도 보여 줄 수 있어요. 두 번째 문장에서는 본론 단락에서 논의할 구체적인 주제를 소개해요.
서론을 쓰세요.
서론 쓰기
각 본론 단락에는 요점을 소개하는 주제문이 필요해요. 이 길이의 에세이라면 본론 단락은 두 개면 충분해요.
단락마다 분명한 문장을 하나씩 쓰세요. 각 문장은 12~20단어로 쓰고, 설명과 예시는 다음 단계를 위해 남겨 두세요.
본론 단락마다 주제문을 하나씩 쓰세요.
주제문 두 개 쓰기
games do not teach work skills
too much screen time harms children
주제문은 뒷받침될 때만 점수를 받아요. 첫 번째 본론 단락을 두 가지 요점으로 전개하세요. 요점마다 설명과 구체적인 예시를 쓰세요.
각 본론 단락은 4~5문장, 즉 60~80단어 정도가 되어야 해요. 일반적인 진술보다 구체적인 상황이 더 설득력 있어요.
첫 번째 본론 단락의 나머지를 쓰세요.
본론 단락 1 전개하기
60
두 번째 본론 단락도 첫 번째만큼 깊이 있게 쓰세요. 두 가지 요점을 쓰고, 각각을 설명과 예시로 뒷받침하세요.
각 본론 단락은 4~5문장, 즉 60~80단어 정도가 되어야 해요. 첫 번째 단락을 표현만 바꿔 되풀이하지 마세요.
두 번째 본론 단락의 나머지를 쓰세요.
본론 단락 2 전개하기
60
결론은 에세이를 마무리해요. 요점을 두 문장으로 요약한 다음, 이 주제가 왜 중요한지 한두 문장을 더하세요.
서론을 베끼지 말고, 새로운 주장을 더하지 마세요. 결론 전체는 35~50단어로 쓰세요.
결론을 3~4문장으로 쓰세요.
결론 쓰기
35
이제 서론, 주제문, 본론 단락, 결론이 하나의 에세이로 함께 보여요. 한 편의 글로 읽으며 문제의 모든 부분에 답하는지 확인하세요.
내 표현을 샘플 에세이와 비교하고, 각 단락이 서로 다른 역할을 어떻게 하는지 살펴보세요.
에세이를 검토한 뒤 다음을 클릭해 계속하세요.
완성한 에세이 다시 보기
판단 방법
Task 2 에세이는 질문의 모든 부분에 답해요. 과제 달성도는 질문이 요구하는 것을 다루고, 각 요점을 설명과 예시로 뒷받침하는지에 달려 있어요.
서론, 주제문 두 개, 충분히 전개한 본론 단락 두 개, 그리고 결론의 정해진 순서대로 쓰세요.
- 서론 쓰기.
일반적으로 이 단락에는 두 문장이 필요해요. 자신의 말과 동의어를 써서 질문을 패러프레이즈하세요. 그러면 에세이가 주제에서 벗어나지 않고, 다양한 어휘를 보여 줄 수 있어요. 두 번째 문장은 본론 단락에서 다룰 구체적인 주제를 소개해요. 따라서 서론에는 다음이 들어가야 해요.
- 다시 쓴 질문
- 구체적인 주제 소개
- 주제문 두 개 쓰기. 본론 단락마다 주제문을 하나씩 쓰세요.
- 본론 단락 전개하기. 각 본론 단락을 두 가지 요점으로 뒷받침하고, 요점마다 설명과 예시를 하나씩 붙이세요. 본론 단락 하나는 4–5문장 정도가 좋아요.
- 결론 쓰기. 요점을 요약한 다음, 그 주제가 왜 중요한지 말하세요.
- 완성한 에세이 다시 보기. 각 부분을 함께 읽고 질문의 모든 부분에 답했는지 확인하세요.
충분히 전개한 단락 두 개가 전개하지 않은 요점 네 개보다 점수가 높아요. 시험관은 뒷받침에 점수를 주므로, 요점을 하나 더 추가하기보다 이미 있는 요점에 설명과 예시를 더하세요.
서론
일반적으로 이 단락에는 두 문장이 필요해요. 자신의 말과 동의어를 써서 질문을 패러프레이즈하세요. 그러면 에세이가 주제에서 벗어나지 않고, 다양한 어휘를 보여 줄 수 있어요. 두 번째 문장은 본론 단락에서 다룰 구체적인 주제를 소개해요. 따라서 서론에는 다음이 들어가야 해요.
- 다시 쓴 질문
- 구체적인 주제 소개
주제문
본론 단락마다 주제문을 하나씩 쓰세요. 각 문장은 그 단락의 요점을 12~20단어로 소개하고, 예시는 다음 단계를 위해 남겨 두세요.
뒷받침
주제문은 뒷받침이 있어야 점수를 받아요. 요점이 왜 맞는지 설명하고, 구체적인 예시를 들고, 두 본론 단락을 같은 정도로 뒷받침하세요. 본론 단락 하나는 4–5문장 정도가 좋아요.
결론
결론은 요점을 두 문장으로 요약한 다음, 그 주제가 왜 중요한지 한두 문장을 덧붙여요. 서론을 그대로 베끼지 말고, 새로운 주장을 더하지 마세요.
IELTS 라이팅 Task 2를 위한 IELTS 라이팅 샘플 및 전략
일반적으로 IELTS 라이팅 Task 2에 접근하는 4단계가 있습니다:
1. 읽고 이해하기 - 이 단계는 자명해 보일 수 있지만, 많은 시험 응시자들은 긴장이 그들을 이기게 하고 현재의 질문을 완전히 이해하지 못합니다. 이것이 라이팅 Task 2에서 가장 먼저 해야 할 일이 질문을 완전히 이해하고 핵심 단어에 밑줄을 긋는 것인 이유입니다. 또한 다음 두 가지를 생각해 보세요:
- 어떤 유형의 에세이를 작성해야 합니까? (예를 들어, 그것은 문제와 해결책일 수 있습니다).
- 이 주제에 얼마나 익숙합니까? (이 질문은 당신이 사용하기로 선택한 개요에 영향을 미칠 수 있기 때문에 중요합니다.
2. 개요 계획 - 이제 질문이 무엇을 묻고 있는지 그리고 어떤 유형의 에세이를 작성해야 하는지 이해했으므로, 개요를 매핑할 준비가 되었습니다. 이 단계를 건너뛰지 마세요. 이것은 단지 2 또는 3분이 걸려야 하며 앞으로 당신에게 참조 역할을 할 것입니다. 또한 질문이 어떻게 묻는지에 따라 개요는 다를 것입니다. 각 에세이 유형에 대해 질문을 분석하고 개요를 계획하는 방법을 배우려면, IELTS 라이팅 task 2 레슨을 확인하세요
3. 개요 메모 작성 - 이제 개요를 선택하고 작성했으므로, 각 단락의 주요 문장의 핵심 단어를 사용하여 개요에 메모를 작성하세요. 이것은 에세이를 "매핑"하는 데 도움이 되고 그것이 어떻게 보일지에 대한 조감도를 제공할 것입니다. 이 단계에서는 이미 각 단락의 주요 주제를 이해할 수 있어야 합니다.4. 쓰기 시작 - 개요를 계획한 후, 도입부터 시작하여 거기서부터 계속해서 쓰세요. 공식적인 어조를 사용하는지 확인하세요(축약어를 사용하지 말고, 10 미만의 숫자는 쓰지 말고 등), 각 단락 후에 들여쓰기를 하세요.
다음 블로그 포스트는 각 질문 유형에 대처하는 방법을 가르치며 100개 이상의 IELTS 라이팅 task 2 질문과 샘플 에세이를 포함합니다. IELTS 준비를 위해 자유롭게 사용하세요.