
IELTS Academic Writing Task 1 - Mixed data questions
This section presents a list of common IELTS Academic Writing Task 1 - Multiple Charts questions. If you want to prepare for the IELTS Writing Test, these questions are a must study.
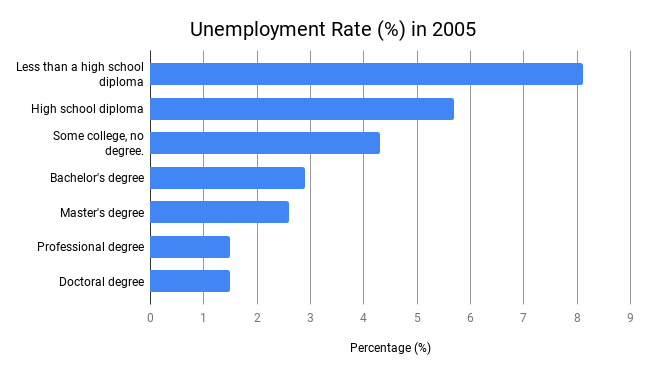
The graphs below show the unemployment rate of citizens in the US with a further classification displaying average salary per week in 2005.
Summarise the data by selecting and reporting the main features and make comparisons where relevant.
Write at least 150 words.
Professional degree | Average Weekly Earnings in 2005 ($) |
Doctoral degree | 1740 |
Professional degree | 1800 |
Master's degree | 1560 |
Bachelor's degree | 1246 |
Some college, no degree | 840 |
High school diploma | 701 |
Less than a high school diploma | 538 |
[Practice and View Model Answer]
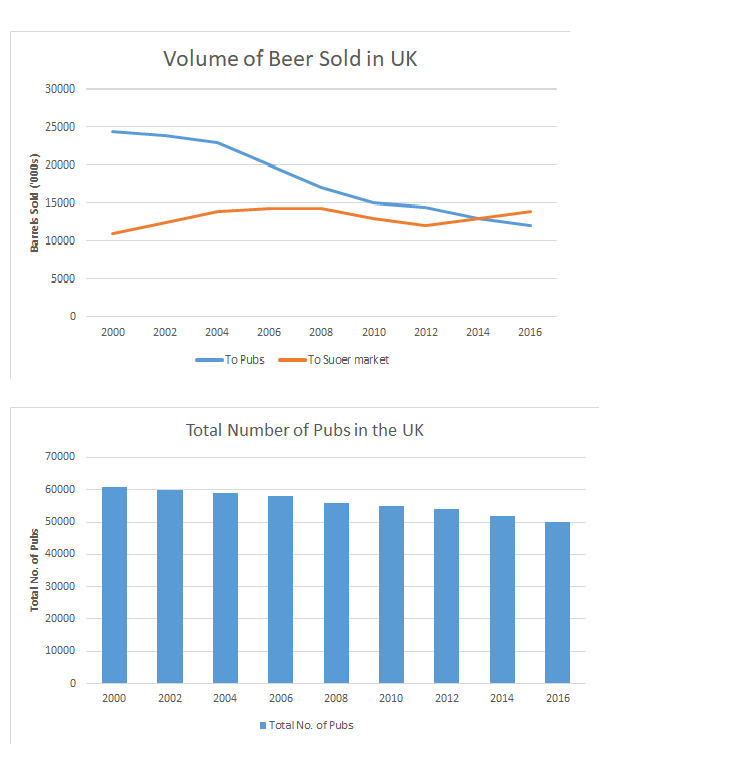
The line charts show the amount of beer sold to pubs and supermarkets over six years, where a bar graph displays the amount of pubs closed over the same period.
Summarise the data by selecting and reporting the main features and make comparisons where relevant.
Write at least 150 words.
[Practice and View Model Answer]
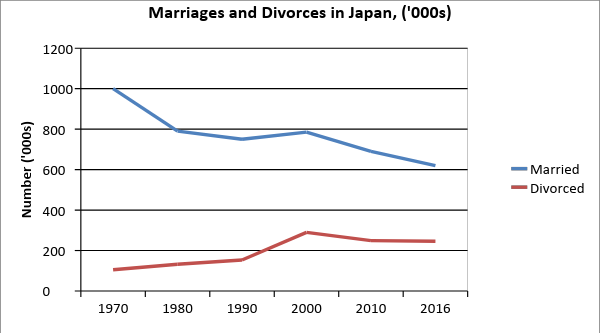
The table shows the proportion of fifty-year-old adults who were never married over five decades in Japan. The chart represents the Japanese marriage and divorce rate from 1970 to 2016.
Summarise the data by selecting and reporting the main features and make comparisons where relevant.
Write at least 150 words.
Number of 50-year-old adults who never been married (%)
Year | Percentage |
1970 | 2% |
1980 | 4% |
1990 | 7% |
2000 | 12% |
2010 | 15% |
[Practice and View Model Answer]
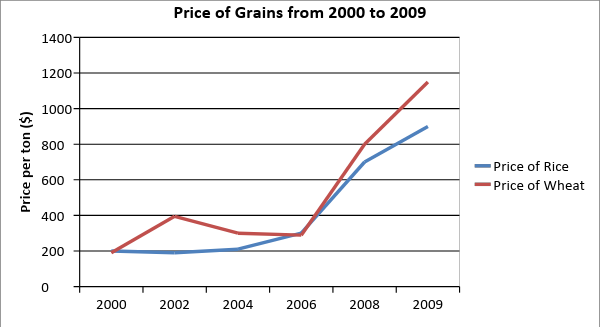
The table shows the number of people (millions) that remain undernourished around the world from 2000 to 2009. The chart displays the global price of two food grains over the same period.
Summarise the data by selecting and reporting the main features and make comparisons where relevant.
Write at least 150 words.
Number of Undernourished People Worldwide
Year | Millions of People |
2000 | 857 |
2002 | 862 |
2004 | 873 |
2006 | 876 |
2008 | 924 |
2009 | 1024 |
[Practice and View Model Answer]
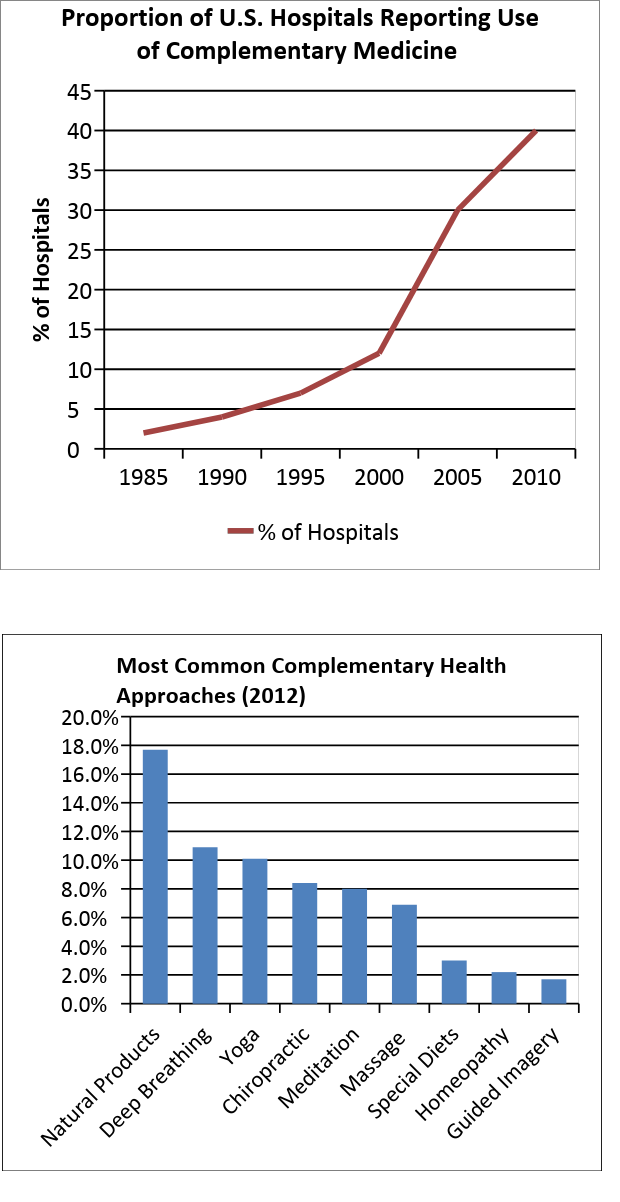
The table shows total revenue created by complementary medicine over three years. The two charts illustrate the number of hospitals offering complementary medicine over twenty five years with a further classification showing which kinds of medicine proved the most popular in 2012.
Summarise the data by selecting and reporting the main features and make comparisons where relevant.
Write at least 150 words.
Revenue from Complementary Medicine in the U.S. (in billion US dollars)
Year | Revenue |
2011 | 11.34 |
2014 | 13.1 |
2016 | 14.3 |
[Practice and View Model Answer]
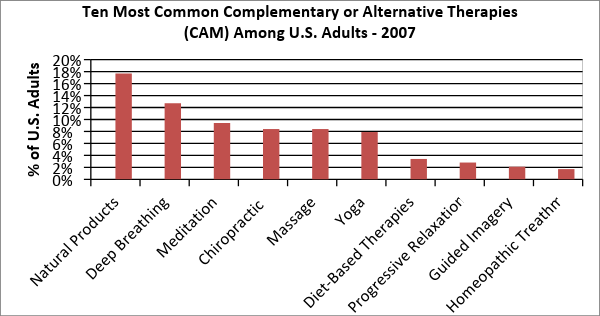
The bar chart below shows the preference for different types of Complementary or Alternative Medicine (CAM) therapies among US adults in 2007. The table lists which therapies where the most popular over two years.
Summarise the data by selecting and reporting the main features and make comparisons where relevant.
Write at least 150 words.
Therapies Showing Significant Gains between 2002 and 2007 (%)
| 2002 | 2007 |
Deep Breathing | 10.6 | 14.8 |
Meditation | 8.6 | 10.5 |
Massage | 5 | 8.6 |
Yoga | 5.1 | 7.1 |
[Practice and View Model Answer]
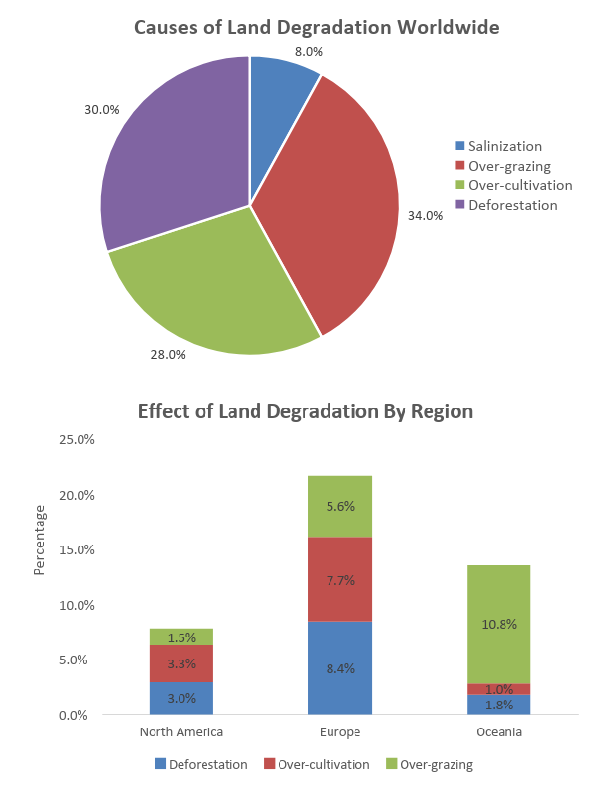
The pie chart below represents the main reasons why agricultural land becomes less productive. The bar chart shows how these causes affected three regions of the world in the 1990s.
Summarise the data by selecting and reporting the main features and make comparisons where relevant.
Write at least 150 words.
[Practice and View Model Answer]
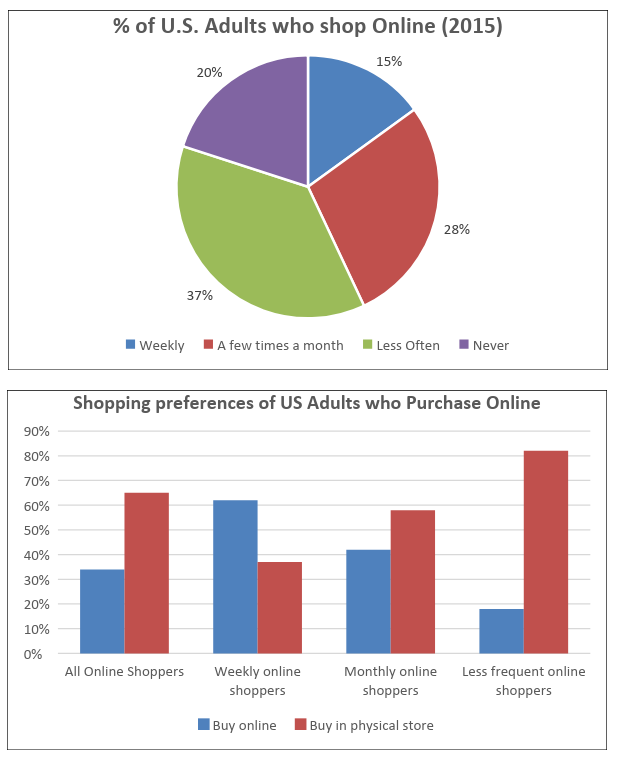
The pie chart below shows the frequency of U.S. Adults’ online purchasing habits in 2015, while the bar chart shows a further classification denoting online purchasing preferences.
Summarise the data by selecting and reporting the main features and make comparisons where relevant.
Write at least 150 words.
[Practice and View Model Answer]
Looking for IELTS preparation?
Check out our NEW IELTS prep online learning tool called IELTS Tutor.
IELTS Tutor will help you achieve your target score with 1500+ IELTS practice questions.