
V tomto průvodci se naučíte psát vysoce hodnocené eseje pro IELTS writing task 1 i IELTS writing task 2. Ať už skládáte jakýkoli test — academic nebo general training — máte vše, co potřebujete: tento průvodce obsahuje ukázkové práce IELTS, témata a podrobné lekce pro general writing task 1 a 2 i academic writing task 1 a 2.
Po dokončení cvičného testu IELTS Writing získejte bezplatné ukázkové odpovědi IELTS Writing.
| Test IELTS General Writing | Test IELTS Academic Writing |
|---|---|
Níže je náš úplný seznam otázek IELTS Writing s ukázkovými esejemi. Poznámka: červené odkazy jsou naše nejoblíbenější a nejdoporučovanější otázky writingu podle hodnocení studentů a můžete je kdykoli zdarma procvičovat.
Ukázky IELTS General Writing Task 1 1 - 44
Informal, formal, & semi-formal letters
Ukázky IELTS Academic Writing Task 1 1 - 52
Line graphs, bar charts, pie charts, tables, maps, flow charts, & multiple charts
Ukázky IELTS Writing Task 2 1 - 96
Opinion, discussion, advantages & disadvantages, problem & solution, cause & effect, & two-part questions
Obsah
Informace o testu IELTS Writing
Test psaní se skládá ze 2 písemných úkolů a celkem máte 60 minut na dokončení obou. Úkoly můžete plnit v libovolném pořadí, jen se ujistěte, že si dobře hospodaříte s časem a strávíte přibližně 20 minut na IELTS writing task 1 a 40 minut na IELTS writing task 2.
IELTS Academic Writing Task vs IELTS General Writing Task
IELTS nabízí dvě verze testu. Verze Academic je určena pro lidi, kteří hledají vyšší vzdělání, zatímco verze General Training je pro ty, kteří chtějí jen emigrovat nebo případně získat nižší úroveň vzdělání. Pro obě verze existuje více kritérií, takže prosím kontaktujte podporu IELTS, abyste zjistili, který test je pro vás vhodný.
Který test je tedy obtížnější? Akademický test, jak byste mohli hádat, je obtížnější než test general training. Rozdíl mezi nimi spočívá v obtížnosti IELTS writing task 1. Naštěstí se liší pouze Writing Task 1. IELTS writing task 2 je stejný pro obě verze testu. Tabulka níže shrnuje dva typy testu IELTS writing.
| Typ testu | Task 1 | Task 2 |
|---|---|---|
| Academic Writing | IELTS Academic Writing Task 1
V IELTS academic writing task 1 dostanete graf, tabulku, diagram nebo schéma a budete požádáni, abyste popsali, shrnuli nebo vysvětlili informace vlastními slovy. |
IELTS Writing Task 2 V IELTS writing task 2 budete muset napsat esej v tradičním stylu jako odpověď na otázku. Musíte napsat alespoň 250 slov |
| General Writing |
IELTS General Writing Task 1
V IELTS General Writing Task 1 budete požádáni, abyste napsali dopis o dané situaci. Tento dopis bude jednoho z následujících typů: - Formální (Formální dopisy se posílají lidem, které neznáme nebo jsme nikdy nepotkali.) - Polo-formální (Polo-formální dopisy se posílají lidem, které neznáme příliš dobře.) - Neformální (Neformální dopisy se posílají lidem, které dobře známe, jako jsou naši přátelé) |
Video přehled IELTS Academic Writing Task
Video přehled IELTS General Writing Task
Brzy!
Jak se boduje test IELTS Writing
V testu IELTS writing bude vaše skóre psaní hodnoceno na základě čtyř kategorií. Jsou známy jako
Task Achievement/Task Response, Coherence and Cohesion, Lexical Resource a Grammatical Range and Accuracy.
Prosím odkažte se na následující popisy bandů, které zkoušející IELTS používají k hodnocení sekce psaní testu:
- Popisy bandů IELTS Writing Task 1
- Popisy bandů IELTS Writing Task 2
Vezměte prosím na vědomí, že hodnotící kritéria pro oba úkoly zahrnují:
- Task Achievement/Task Response - Odpověděli jste plně na otázku a poskytli plně rozvinutou odpověď?
- Coherence and Cohesion - Dává váš argument nebo analýza smysl? Je dobře promyšlena a prezentována v plné formě?
- Lexical Resource – Použili jste širokou škálu slovní zásoby v přirozeném, formálním tónu?
- Grammatical Range and Accuracy – Je vaše esej prakticky bez chyb? Podařilo se vám použít širokou škálu gramatických konstrukcí?
Mají IELTS Writing Task 1 a IELTS Writing Task 2 stejnou hodnotu bodů?
Stejně jako strávíte dvakrát tolik času psaním IELTS writing task 2,
má také přibližně dvakrát větší hodnotu bodů. Není to úplně dvakrát tolik.
Jiný způsob pohledu na to je sčítat skóre za writing task 2 dvakrát. Vezměte tedy
band score 7 za task one a 4 za task two a získáte následující
vzorec pro výpočet vašeho skóre IELTS writing:
(7 + (4 x 2))/3 = 5.
Proto je celkové band score IELTS writing přibližně 4,5 - 6. Vidíte, nemůžeme dát přesné číslo,
protože IELTS neudělal svůj vzorec bodování veřejně dostupným, ale prezentovaný vzorec
je dostatečně přesný s rozdílem přibližně 0,5 bandu.
Co ukazuje 19 000 ohodnocených esejí IELTS
V letech 2020 až 2026 lektoři BestMyTest ohodnotili přibližně 9 400 písemných úloh IELTS a náš systém hodnocení pomocí AI opravil dalších 9 614 esejí. Vynikají tři zjištění.
- O výsledném pásmu rozhoduje gramatika. Gramatický rozsah a přesnost byly nejhůře hodnoceným ze čtyř kritérií u 91% esejí v Task 2, 84% zpráv v Academic Task 1 a 94% dopisů v General Training. Průměrná hodnocení lektorů pro Task 2: gramatika 5.5, slovní zásoba 6.0, soudržnost a návaznost 6.1, zpracování zadání 6.1. Pro Academic Task 1: gramatika 5.5, soudržnost 5.8, splnění zadání 5.8, slovní zásoba 5.8. Pro General Training Task 1: gramatika 5.3, slovní zásoba 5.9, soudržnost 6.0, splnění zadání 6.2.
- Krátké eseje jsou penalizovány. 17% esejí v Task 2 nedosáhlo minima 250 slov a jejich průměrné hodnocení za zpracování zadání bylo 4.9 oproti 6.1 u esejí, které dosáhly 250 slov. 13% zpráv v Academic Task 1 a 16% dopisů v General Training mělo méně než 150 slov. Naši studenti píší v průměru 285 slov v Task 2 a přibližně 175 slov v Task 1.
- Chyby jsou drobné a opakují se. Esej v Task 2 vyžaduje přibližně 21 oprav. Nejčastější jsou chyby v interpunkci (17% oprav), dále ve členech (11%), pravopisu (10%), jednotném a množném čísle podstatných jmen (9%), shodě podmětu s přísudkem (7%) a předložkách (6%). Dvě třetiny esejí v Task 2 obsahovaly chybu ve členu a 58% chybu ve shodě podmětu s přísudkem. V Academic Task 1 způsobuje další chyby slovní zásoba používaná při popisu dat: "male" na "males", "increase" na "increased", "compare" na "compared". V dopisech v General Training hrají velká písmena (9% oprav) a slovesné časy (6%) větší roli než v ostatních úlohách.
- Nejčastější opravy v našem hodnocení: "this" na "these", "is" na "are", "have" na "has", "in" na "on", "of" na "for", "amount" na "number", "then" na "than", "that" na "who", "goverment" na "government", "belive" na "believe", "accomodation" na "accommodation".
Údaje pocházejí z cvičných testů a hodnocení BestMyTest do října 2026. Procenta u typů otázek vyjadřují podíl správných odpovědí ze všech pokusů; údaje u kritérií představují hodnocení lektorů nebo AI podle uvedeného označení. Poslední aktualizace 5. října 2026.
IELTS Academic Writing Task 1
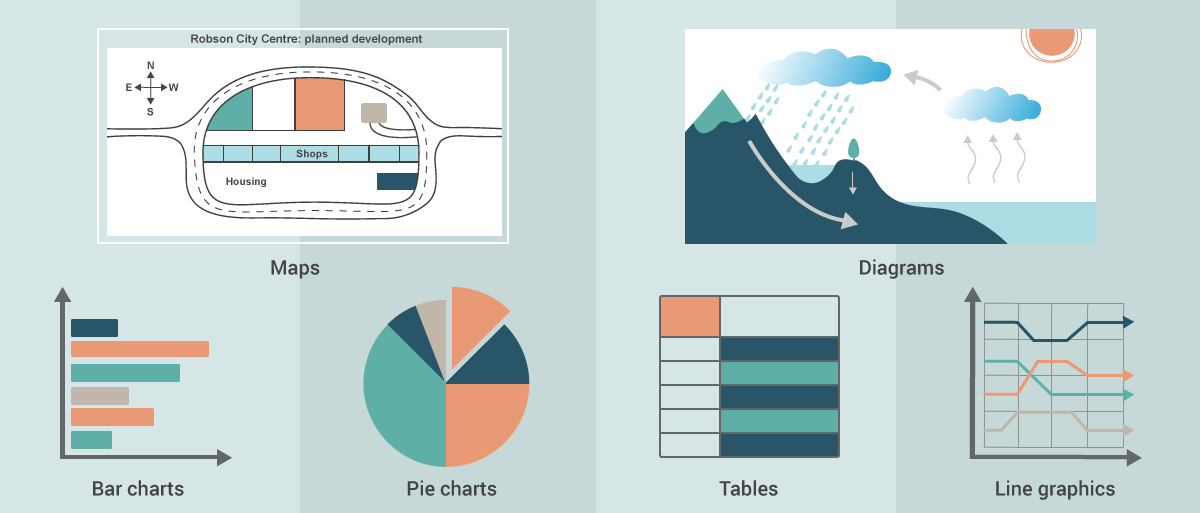
V IELTS academic writing task 1 dostanete graf, tabulku, diagram nebo schéma a budete požádáni, abyste popsali, shrnuli nebo vysvětlili informace vlastními slovy. Můžete být požádáni, abyste popsali a vysvětlili data, popsali fáze procesu, jak něco funguje, nebo popsali objekt nebo událost.
Bez ohledu na to, jaké vizuální informace vám jsou prezentovány, vaším úkolem je napsat shrnutí vizuálních informací a popsat hlavní trendy, celkové rozdíly, hlavní změny nebo hlavní složky systému, nebo hlavní fáze procesu. Musíte napsat 150 slov nebo více a měli byste strávit přibližně 20 minut na této části testu. Struktura psaní může být následující:
- Úvod: Parafrázujte otázku
- Přehled: Popište celkový trend nebo napište celkový přehled hlavních seskupení
- Hlavní odstavec 1: Pište podrobně o prvním seskupení logicky
- Hlavní odstavec 2: Pište podrobně o druhém seskupení logicky
Kroky pro napsání zprávy v tomto úkolu jsou tedy velmi jednoduché:
- Analyzujte diagram(y) a naplánujte, jak seskupit informace
- Napište esej s použitím doporučené struktury eseje
- Zkontrolujte esej
Pojďme se podívat na každý možný typ vizuálních grafů, tabulek, diagramů a schémat, se kterými se můžete setkat ve vašem testu IELTS writing:
Spojnicové grafy
V tomto typu úkolu dostanete jeden nebo více spojnicových grafů. Každý spojnicový graf bude mít 1-8 čar ukazujících, jak se hodnoty mění v čase. Časové období může být minulé, současné nebo budoucí, nebo kombinace všech tří. Vaším úkolem je napsat shrnutí, pokrývající nejdůležitější body a podporujíc váš popis začleněním dat.
The chart illustrates average CO2 emissions per person in four European countries between 1975 and 2015.
Summarise the information by selecting and reporting the main features, and make comparisons where relevant.
- Write at least 150 words.
- You should spend around 20 minutes on this task.
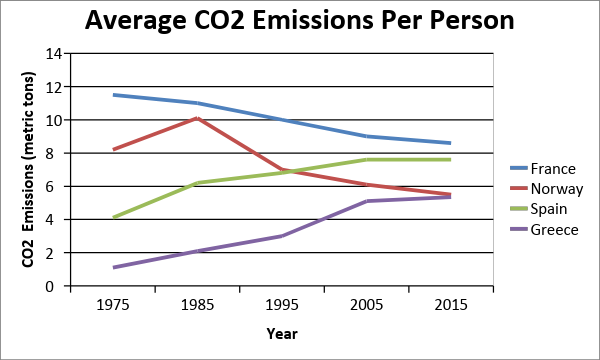
The line graph depicts the average Carbon dioxide emission for each individual residing in four countries, namely France, Norway, Spain, and Greece, over 40 years.
Overall, although CO2 production in France and Norway declined, it increased significantly in Spain and Greece over the period. Norway improved the most to become the most environmentally friendly, whereas Greece had the highest increase of all in that time.
Throughout the period, France produced the most CO2, though production declined overall from 11 tonnes per individual in 1975 to around 8.5 tonnes by 2015. In turn, except for a spike in emissions in 1985, Norway’s production of CO2 fell from 8 to under 6 tonnes forty years later.
On the contrary, CO2 release in Spain and Greece saw a more upward turn. In Spain, production doubled from 4 tonnes in 1975, overtaking Norway by 1995, to a final figure of just under 8 metric tonnes per head of population. Similarly, emissions in Greece, which were the lowest in 1975, increased five times to equal those of Norway in 2015.

Line Chart
Learn how to answer this question in a step-by-step interactive exercise
Line Chart
V úloze IELTS Academic Task 1 popisujete, co graf ukazuje. Nevyjadřujete názor a nevysvětlujete, proč čísla vypadají tak, jak vypadají.
Spojnicový graf ukazuje, jak se hodnoty mění v čase, často u několika čar najednou, takže tato zpráva popisuje změnu a porovnává jednotlivé čáry.
Prohlédněte si zadání a pak klikněte na Další, abyste mohli pokračovat.
Prohlédněte si otázku
Summarise the information by selecting and reporting the main features, and make comparisons where relevant.
Write at least 150 words.
Než začnete psát, přečtěte si graf. Zkontrolujte název, časové období na vodorovné ose, jednotky na svislé ose a legendu, která pojmenovává každou čáru.
Pak najděte bod, kde končí naměřená data a začíná předpověď. Tento bod rozděluje slovesné časy: minulé tvary pro roky, které už jsou naměřené, a tvary jako is expected to, is predicted to a is set to pro roky, které teprve přijdou.
Odpovězte na otázky ke grafu.
Přečtěte si graf
Úvod vlastními slovy říká, co graf ukazuje. Parafrázujte zadání: změňte formulaci, zachovejte význam a ponechte téma, to, co čáry měří, a časové období.
Opsaná věta ze zadání vám nic nepřinese a čísla sem nepatří. Všechny údaje si nechte pro hlavní odstavce.
Napište jednu nebo dvě věty, které parafrázují zadání.
Napište úvod
Zadání úlohy
The chart illustrates average CO2 emissions per person in four European countries between 1975 and 2015.
Summarise the information by selecting and reporting the main features, and make comparisons where relevant.
Write at least 150 words.
Zpráva v Task 1 potřebuje jeden hlavní odstavec pro každou skupinu čar a spojnicový graf má obvykle více čar než skupin. Seskupte čáry, které se pohybují stejným směrem: čáry, které rostou, čáry, které klesají, a čáry, které zůstávají na stejné úrovni. Pokud se všechny čáry pohybují stejně, vznikne jeden odstavec; pokud je od každého druhu jedna, vzniknou tři.
Jeden odstavec pro každou čáru nebo pro každou polovinu období naruší srovnání, které zadání požaduje. Seskupení jen podle úrovně může dát rostoucí a klesající čáru do stejného odstavce.
Vyberte seskupení, které dá každému odstavci jeden jasný vzorec.
Vytvořte skupiny
Vyberte seskupení, které dá každému odstavci jeden jasný vzorec.
- Group 1: Norway, Spain, Greece. Group 2: France.
- Group 1: Greece. Group 2: France, Norway, Spain.
- Group 1: Norway, Greece. Group 2: France, Spain.
- Group 1: France, Norway. Group 2: Spain, Greece.
Přehled je největší vzorec v celém grafu. Tvoří ho hlavní rysy. Nejprve: jaký je celkový směr každé skupiny v průběhu období? Potom: pokud jsou skupiny dvě nebo více, jak daleko od sebe zůstávají první a poslední skupina a zda se tento rozdíl zvětšuje, zmenšuje, nebo se skupiny prohodí?
Dejte tyto rysy dohromady a máte přehled. Nepřidávejte sem jednotlivé roky ani čísla. Nechte si je pro hlavní odstavce.
Najděte hlavní rysy, ze kterých sestavíte přehled.
Najděte celkový trend
Nyní převeďte dva hlavní rysy do jedné nebo dvou vět. Přehled je část zprávy, kterou zkoušející hledá jako první, proto ho napište před jakýmikoli detaily a držte ho obecný.
Zvolte slovesný čas podle grafu a popište, co graf ukazuje, ne proč. Neuvádějte čísla a nepřidávejte názor.
Napište jednu nebo dvě obecné věty o největším vzorci.
Napište přehled
Hlavní odstavec 1 se věnuje pouze vaší první skupině čar v průběhu celého období a právě sem patří čísla.
Popište tvar každé čáry, ne každý její bod: výchozí hodnotu, směr, každou změnu směru a konečnou nebo předpovídanou hodnotu. Použijte výrazy pro změnu v čase jako rise steadily, fluctuate, level off a peak a ke každému číslu uveďte rok.
Pokud si nejste jisti, jak bod formulovat, klikněte na něj a do pole pro psaní se přidá ukázková věta.
Napište tři nebo čtyři věty o své první skupině, včetně čísel.
Napište hlavní odstavec 1
Hlavní odstavec 2 se věnuje pouze vaší druhé skupině čar. Zpracujte ji stejně: tvar každé čáry podložený čísly.
Neopakujte hlavní odstavec 1. Skupiny propojte tam, kde stojí za to rozdíl pojmenovat, pomocí výrazů jako in contrast a far lower than.
Pokud si nejste jisti, jak bod formulovat, klikněte na něj a do pole pro psaní se přidá ukázková věta.
Napište tři nebo čtyři věty o své druhé skupině, včetně čísel.
Napište hlavní odstavec 2
Plán vaší zprávy je hotový. Dokončená odpověď v Task 1 má tyto části v tomto pořadí: úvod, který parafrázuje zadání, přehled největšího vzorce a jeden hlavní odstavec pro každou skupinu, který tento vzorec podkládá vybranými čísly.
Přečtěte si své části společně a zkontrolujte tři věci: přehled a detaily se shodují, slovesný čas odpovídá naměřeným a předpovídaným hodnotám a každé číslo má svou jednotku a svůj rok.
Projděte si plán zprávy a pak ho porovnejte se vzorovou esejí.
Plán celé zprávy
Jak se rozhodnout
Spojnicový graf v IELTS Academic Task 1 ukazuje, jak se hodnoty mění v čase, často u několika čar najednou. Popisujete tyto změny a porovnáváte čáry. Nepotřebujete každý bod na každé čáře.
Postupujte v pevném pořadí, abyste měli zprávu naplánovanou dřív, než napíšete první větu.
- Přečtěte si graf. Zkontrolujte název, časové období, jednotky, legendu a to, kde končí naměřená data a kde případně začíná předpověď.
- Napište úvod. Parafrázujte zadání a uveďte, co graf ukazuje.
- Vytvořte skupiny. Seskupte čáry, které se chovají podobně, aby měl každý hlavní odstavec jednu jasnou myšlenku.
- Najděte celkový trend. Než se podíváte na jednotlivé hodnoty, určete největší vzorec v celém grafu.
- Pište zprávu po částech. Nejdřív napište přehled, pak jeden hlavní odstavec pro každou skupinu s vybranými čísly a pak zkontrolujte celý plán.
Čáry nejdřív seskupte, teprve pak je popisujte. Z grafu s mnoha čarami se stane krátká zpráva, jakmile podobné čáry sdílejí jeden odstavec, a právě seskupování zadání myslí výběrem hlavních rysů.
Přečtěte si graf
Začněte osami. Vodorovná osa udává časové období, svislá osa udává jednotky a legenda pojmenovává každou čáru. Najděte bod, kde končí naměřená data, protože vše za ním je předpověď a vyžaduje budoucí tvary.
Úvod
Úvod tvoří jedna nebo dvě věty, které jinými slovy než zadání říkají, co graf ukazuje. Zachovejte téma, co čáry měří, a časové období. Čísla a trendy vynechte.
Skupiny
Zpráva v Task 1 má jeden hlavní odstavec pro každou skupinu čar. Seskupte čáry, které se pohybují stejným směrem: čáry, které stoupají, čáry, které klesají, a čáry, které zůstávají na stejné úrovni. Když se všechny čáry pohybují stejně, vznikne jeden odstavec; když je od každého druhu jedna, vzniknou tři.
Celkový trend
Celkový trend je největší vzorec v grafu: obecný směr každé skupiny v průběhu období a jak daleko od sebe skupiny zůstávají. Jde o obecné tvrzení, takže neobsahuje žádná čísla.
Chcete-li se naučit zvládat spojnicové grafy IELTS Academic Writing Task 1, podívejte se na naši lekci IELTS Academic Writing Task - Line Graphs.
7-denní bezplatná zkušební verzeSloupcové grafy
V tomto typu úkolu dostanete jeden nebo více sloupcových grafů. Sloupcové grafy mohou ukazovat jak se hodnoty mění v čase (dynamická data), rozdíly mezi hodnotami v jednom okamžiku (statická data) nebo výsledky průzkumu nebo dotazníku. Informace mohou být o situaci v minulosti, současnosti nebo budoucnosti, nebo kombinaci všech tří. Vaším úkolem je napsat shrnutí, pokrývající nejdůležitější body a podporujíc váš popis začleněním dat.
The chart below shows the proportion of males and females in Malaysia who commonly do physical activity in 2010.
Summarise the information by selecting and reporting the main features, and make comparisons where necessary.
- Write at least 150 words.
- You should spend around 20 minutes on this task.
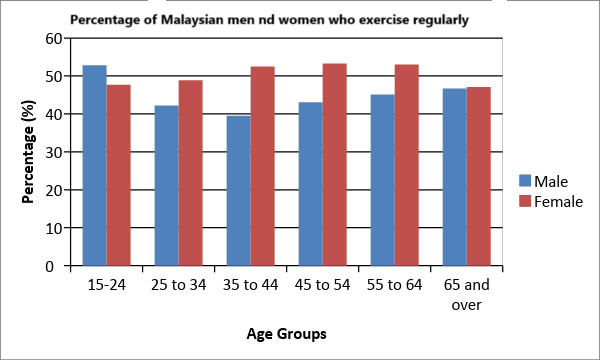
The bar chart compares the proportion of male and females of differing age groups who frequently undertook physical activity in 2010.
Overall, while the Malaysian population keeps fit in general, a higher proportion of women than men exercised in 2010, with some further differences between age groups. Middle-aged females were the most likely to work out, while for men, those aged 15 to 24 tended to do the most physical activity.
In terms of men’s exercise habits, younger men were much more likely to exercise than older men with 52.8% of those aged under 24 exercising as opposed to only around 40% of older age groups
By contrast, around half of all women in all age groups reported keeping fit, especially those aged between 35 and 64 at around 53%. The exception was the youngest age group in which only 47.7 percent of women exercised compared to 52.8% of men. Similarly, for people 65 and over, just approximately 47% of both sexes were recorded regularly working out.
Bar Chart
Learn how to answer this question in a step-by-step interactive exercise
Bar Chart
V úloze IELTS Academic Task 1 popisujete, co graf ukazuje. Nevyjadřujete názor a nevysvětlujete, proč čísla vypadají tak, jak vypadají.
Sloupcový graf porovnává skupiny v řadě kategorií, takže tato zpráva stojí na srovnáních, ne na změně v čase.
Prohlédněte si zadání a pak klikněte na Další, abyste mohli pokračovat.
Prohlédněte si otázku
Summarise the information by selecting and reporting the main features, and make comparisons where necessary.
Write at least 150 words
Než začnete psát, přečtěte si graf. Zkontrolujte název, kategorie na vodorovné ose, jednotky na svislé ose a legendu, která pojmenovává každou skupinu sloupců.
Jednotky rozhodují o vašich formulacích. Počty lidí, procenta a peněžní částky nejsou totéž a uvedení špatné jednotky vás stojí body, i když je zbytek věty správně.
Odpovězte na otázky ke grafu.
Přečtěte si graf
Úvod vlastními slovy říká, co graf ukazuje. Parafrázujte zadání: změňte formulaci, zachovejte význam a ponechte téma, porovnávané skupiny a místo či období, pokud je zadání uvádí.
Opsaná věta ze zadání vám nic nepřinese a čísla sem nepatří. Všechny údaje si nechte pro hlavní odstavce.
Napište jednu nebo dvě věty, které parafrázují zadání.
Napište úvod
Zadání úlohy
The chart below shows the proportion of males and females in Malaysia who commonly do physical activity in 2010.
Summarise the information by selecting and reporting the main features, and make comparisons where necessary.
Write at least 150 words
Zpráva v Task 1 potřebuje jeden hlavní odstavec pro každou skupinu, takže se včas rozhodněte, jak data rozdělíte. Seskupte řady z legendy, které se chovají podobně: řady, které jsou na podobné úrovni nebo jsou vyšší a nižší ve stejných kategoriích, sdílejí odstavec. Řady, které se chovají jinak, dostanou vlastní. Každý odstavec pak nese jednu jasnou myšlenku.
Rozdělení, které jen odděluje vysoké hodnoty od nízkých nebo dává každé kategorii vlastní odstavec, vás nutí se opakovat.
Vyberte seskupení, které dá každému odstavci jednu jasnou myšlenku.
Vytvořte skupiny
Vyberte seskupení, které dá každému odstavci jednu jasnou myšlenku.
- Group 1: Female. Group 2: Male.
- One group: Male and Female.
Přehled je největší vzorec v celém grafu. Tvoří ho až tři hlavní rysy. Která skupina je vyšší ve většině kategorií? Která skupina je nejnižší ve většině kategorií? Je rozdíl ve všech kategoriích zhruba stejný, nebo se jedna kategorie od ostatních výrazně liší?
Ne každý graf ukazuje všechny tři, proto se tento krok ptá jen na rysy, na kterých u tohoto grafu záleží. Dejte je dohromady a máte přehled. Nepřidávejte sem jednotlivá čísla. Nechte si je pro hlavní odstavce.
Najděte hlavní rysy, ze kterých sestavíte přehled.
Najděte celkový trend
Nyní převeďte nalezené hlavní rysy do jedné nebo dvou vět. Přehled je část zprávy, kterou zkoušející hledá jako první, proto ho napište před jakýmikoli detaily a držte ho obecný.
Popište, co graf ukazuje, ne proč to tak vypadá. Neuvádějte čísla a nepřidávejte názor.
Napište jednu nebo dvě obecné věty o největším vzorci.
Napište přehled
Hlavní odstavec 1 se věnuje pouze vaší první skupině a právě sem patří čísla.
Vyberte srovnání, na kterých záleží: nejvyšší hodnotu, nejnižší hodnotu a každou kategorii, která se chová jinak než ostatní. Protože sloupcový graf porovnává skupiny ve stejném období, použijte výrazy pro srovnání jako higher than, twice as many as a the largest of all the categories.
Pokud si nejste jisti, jak bod formulovat, klikněte na něj a do pole pro psaní se přidá ukázková věta.
Napište tři nebo čtyři věty o své první skupině, včetně čísel.
Napište hlavní odstavec 1
Hlavní odstavec 2 se věnuje pouze vaší druhé skupině. Zpracujte ji stejně jako první: nejzřetelnější srovnání podložená čísly.
Neopakujte hlavní odstavec 1. Skupiny propojte tam, kde stojí za to rozdíl pojmenovat, pomocí výrazů jako in contrast a compared with.
Pokud si nejste jisti, jak bod formulovat, klikněte na něj a do pole pro psaní se přidá ukázková věta.
Napište tři nebo čtyři věty o své druhé skupině, včetně čísel.
Napište hlavní odstavec 2
Plán vaší zprávy je hotový. Dokončená odpověď v Task 1 má tyto části v tomto pořadí: úvod, který parafrázuje zadání, přehled největšího vzorce a jeden hlavní odstavec pro každou skupinu, který tento vzorec podkládá vybranými čísly.
Přečtěte si své části společně a zkontrolujte tři věci: přehled a detaily se shodují, každé číslo má svou jednotku a graf jste popsali, aniž byste ho vysvětlovali.
Projděte si plán zprávy a pak ho porovnejte se vzorovou esejí.
Plán celé zprávy
Jak se rozhodnout
Sloupcový graf v IELTS Academic Task 1 po vás chce popsat, co graf ukazuje, a porovnat skupiny v něm. Nepotřebujete každé číslo. Potřebujete srovnání, na kterých záleží.
Postupujte v pevném pořadí, abyste měli zprávu naplánovanou dřív, než napíšete první větu.
- Přečtěte si graf. Než cokoli napíšete, zkontrolujte název, kategorie, jednotky a legendu.
- Napište úvod. Parafrázujte zadání a uveďte, co graf ukazuje.
- Vytvořte skupiny. Rozdělte data tak, aby měl každý hlavní odstavec jednu jasnou myšlenku.
- Najděte celkový trend. Než se podíváte na jednotlivé hodnoty, určete největší vzorec v celém grafu.
- Pište zprávu po částech. Nejdřív napište přehled, pak jeden hlavní odstavec pro každou skupinu s vybranými čísly a pak zkontrolujte celý plán.
Jasný přehled má větší cenu než další čísla. Zadání po vás chce vybrat hlavní rysy, takže obecné tvrzení s několika výraznými srovnáními získá víc bodů než výčet všech hodnot.
Přečtěte si graf
Začněte osami. Vodorovná osa pojmenovává, co se porovnává, svislá osa udává jednotky a legenda pojmenovává každou skupinu sloupců. Zpráva, která uvede špatnou jednotku, mění význam každé své věty.
Úvod
Úvod tvoří jedna nebo dvě věty, které jinými slovy než zadání říkají, co graf ukazuje. Zachovejte téma, srovnávané skupiny a místo nebo čas. Čísla a trendy vynechte.
Skupiny
Zpráva v Task 1 má jeden hlavní odstavec pro každou skupinu. Seskupte datové řady z legendy, které se chovají podobně: řady na podobné úrovni nebo řady, které jsou vyšší a nižší ve stejných kategoriích. Pak každý odstavec obsahuje jednu myšlenku a nikdy se neopakujete.
Celkový trend
Celkový trend je největší vzorec v grafu: která skupina je ve většině kategorií vyšší, která skupina je ve většině kategorií nejnižší a zda je rozdíl ve všech kategoriích zhruba stejný, nebo se jedna kategorie výrazně liší. Graf může ukazovat jeden, dva nebo všechny tři vzorce. Jde o obecné tvrzení, takže neobsahuje žádná čísla.
Sloupcové grafy jsou v IELTS writing task 1 academic poměrně časté. Existují tři různé scénáře, se kterými se setkáte v úkolu se sloupcovým grafem:
- Sloupcový graf s kategoriemi na ose x
- Sloupcový graf s daty nebo roky na ose (funguje jako spojnicový graf)
- Jsou dány dva sloupcové grafy
Každý scénář vyžaduje psát zprávu jiným způsobem. Zaregistrujte se k 7-denní bezplatné zkušební verzi pro přístup k následujícím lekcím o sloupcových grafech:
- IELTS Academic Writing Task - Bar Charts Part 1 lekce.
- IELTS Academic Writing Task - Bar Charts Part 2 lekce.
- IELTS Academic Writing Task - Bar Charts Part 3 lekce.
Koláčové grafy
V tomto typu úkolu dostanete jeden, dva nebo tři koláčové grafy. Koláčové grafy mohou ukazovat procenta z celkového čísla. Pokud máte jeden koláčový graf, bude reprezentovat jeden okamžik v čase (statická data). Pokud máte dva nebo více koláčových grafů, mohou reprezentovat jak se procenta mění v čase nebo porovnávat různé země nebo skupiny. Vaším úkolem je napsat shrnutí, pokrývající nejdůležitější body a podporujíc váš popis začleněním dat.
The charts below show the percentage of water used for different purposes in six areas of the world. Summarise the information by selecting and reporting the main features, and make comparisons where relevant.
- Write at least 150 words.
- You should spend around 20 minutes on this task.
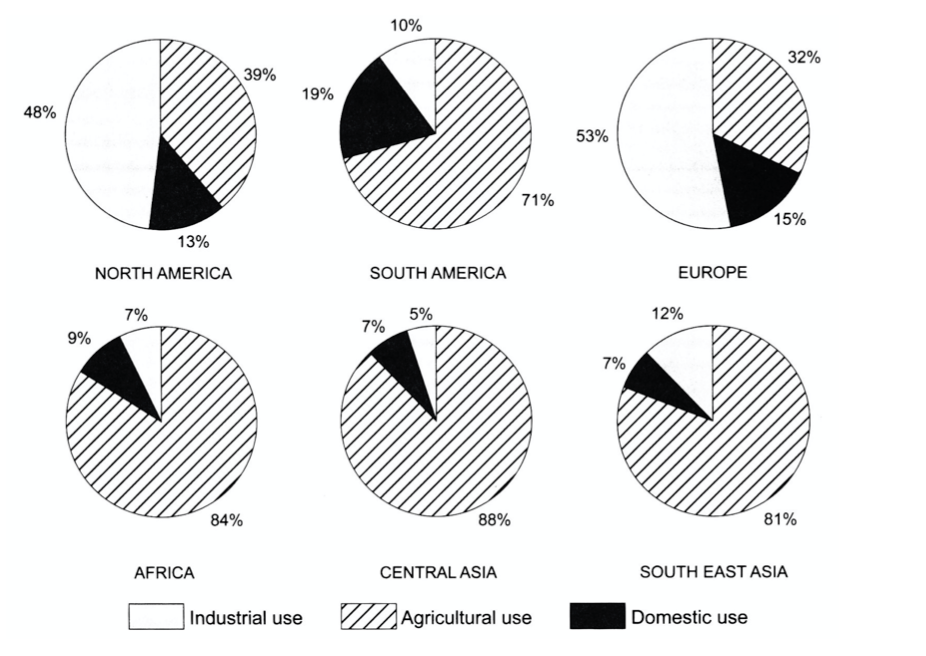
The pie charts provide information regarding the proportions of water used for industrial, agriculture, and domestic use in six regions.
In general, water serves mostly an industrial purpose in North America and Europe, whereas it is predominantly used for agriculture in South America, Africa, Central Asia, and South-East Asia.
Regarding industrial and domestic use, North America and Europe consume an average of approximately 50 percent of water for industrial purposes. However, these two regions report much less water consumption for domestic purposes, utilizing 13 percent and 15 percent, respectively. Out of all six regions, South America dedicates the highest percentage of water consumption for domestic use, but uses only 10 percent for industrial reasons. Both industrial and domestic use remain the least popular choices in Africa, Central Asia, and South-East Asia, where their combined use makes up less than 20 percent of the overall water consumption in each of the three regions.
Agricultural use, on the other hand, accounts for 71 percent of water consumption in South America and over three-fourths of water use in Africa, South-East Asia, and Central Asia, where it is nearly 90 percent. North America and Europe consume less than 40 percent of water for agricultural purposes.
Chcete-li se naučit zvládat koláčové grafy IELTS Academic Writing Task 1, zaregistrujte se k 7-denní bezplatné zkušební verzi pro přístup k lekci IELTS Academic Writing Task - Pie Charts.
7-denní bezplatná zkušební verzeTabulky
V tomto typu úkolu dostanete tabulku obsahující data. Může ukazovat dynamická čísla, která se mění v čase, nebo statická data v jednom okamžiku. Často je informací příliš mnoho na to, abyste mohli zahrnout každý detail. Vaším úkolem je napsat shrnutí, pokrývající nejdůležitější body a podporujíc váš popis začleněním dat.
The table below gives the average time spent and distance traveled by UK commuters in one year. Time and distance are given in minutes and miles accordingly.
Summarise the information by selecting and reporting the main features, and make comparisons where relevant.
Commuting Habits of different regions of the UK in a year
UK Region | Average Commuting Time (minutes) | Average Commuting Distance (miles) |
London | 54 | 14 |
South East | 78 | 20 |
Scotland | 45 | 19 |
West Midlands | 39 | 18 |
North West | 36 | 18 |
Northern Ireland | 36 | 15 |
Yorkshire & Humberside | 36 | 14 |
South West | 34 | 16 |
East Anglia | 33 | 15 |
North East | 32 | 19 |
East Midlands | 32 | 15 |
Wales | 27 | 14 |
- Write at least 150 words.
- You should spend around 20 minutes on this task.
The table shows data on the average commuting time (minutes) and distance (miles) completed by UK citizens in 12 different regions in one year.
Overall, with the exception of London, the further people travel, the more time they need to reach work people. Commuters in the south east region spend the longest time commuting over the greatest distance, whereas people in Wales spend the least.
Regarding the top three UK regions, on average, people in the south east travel both the farthest and longest at 20 miles over 78 minutes. Likewise inhabitants of Scotland journey a similar distance to work, yet spend almost half the time doing so at 45 minutes to get there, while those living in London spend the second-longest time travelling (54 minutes) over just 14 miles.
Of the other regions, people in the West Midlands spent the most time travelling at 39 minutes whereas those in Wales recorded the lowest time at 27 minutes. With regard to distance, residents of the North East, West Midlands and North West recorded the greatest mileage at 19, 18 and 18 miles respectively, while people in Yorkshire and Humberside as well as Wales both travelled the shortest distance to work of all at 14 miles.
Chcete-li se naučit zvládat tabulky IELTS Academic Writing Task 1, zaregistrujte se k 7-denní bezplatné zkušební verzi pro přístup k následujícím lekcím:
- IELTS Academic Writing Task - Tables Part 1 lekce.
- IELTS Academic Writing Task - Tables Part 2 lekce.
Procesní diagramy
Pro tento typ otázky dostanete diagram, který ukazuje, jak něco funguje.
Diagram může ukazovat stroj, systém nebo přírodní jev.
Často je málo nebo žádná data.
Vaším úkolem je shrnout informace zobrazené v diagramu.
The diagram below shows the water cycle, which is the continuous movement of water on, above and below the surface of the Earth.
Summarise the information by selecting and reporting the main features.
- Write at least 150 words.
- You should spend around 20 minutes on this task.
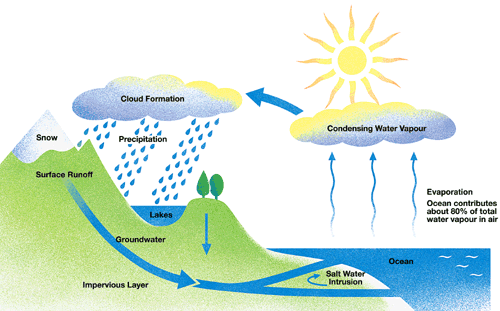
The diagram illustrates the hydrological cycle by which water moves through our natural environment. Overall, there are several stages to the process involving evaporation, precipitation and the final return of water to the ocean where the process begins over.
Since 80% of all water begins in the ocean, most water originates from this source. Initially sea water is warmed by the sun, causing it to evaporate into the air becoming water vapor. This then rises to condense into clouds at a higher elevation, which are then then pushed by the wind over land where it condenses further and precipitation occurs, falling as either snow or rain.
After precipitation on land, water then takes one of three routes. Some of it may fall into lakes or return to the ocean as surface runoff. Still further water percolates underground to an impermeable layer where it again flows back to the sea. Salt water also intrudes from the ocean into the land in coastal areas.

Process Diagram
Learn how to answer this question in a step-by-step interactive exercise
Process Diagram
Úloha s diagramem procesu v IELTS Academic Task 1 ukazuje krok za krokem, jak se něco vyrábí nebo jak funguje nějaký systém. Popisujete fáze v pořadí, v jakém je diagram ukazuje, a neuvádíte důvody ani názory.
Prohlédněte si zadání úlohy a pak klikněte na Další, abyste mohli pokračovat.
Prohlédněte si otázku
Summarise the information by selecting and reporting the main features.
Write at least 150 words.
Než cokoli napíšete, ujistěte se, že diagramu rozumíte. Spočítejte kroky a sledujte šipky, abyste viděli, kde proces začíná a kde končí. Pokud se poslední šipka vrací k první fázi, jde o cyklus a žádný konečný produkt neexistuje.
Odpovězte na otázky k diagramu.
Přečtěte si graf
Úvod čtenáři říká, co diagram ukazuje. Parafrázujte zadání úlohy vlastními slovy, místo abyste ho opsali, a pojmenujte proces. Nepopisujte zde žádný z kroků.
Napište jednu nebo dvě věty úvodu.
Napište úvod
Zadání úlohy
The diagram below shows the water cycle, which is the continuous movement of water on, above and below the surface of the Earth.
Summarise the information by selecting and reporting the main features.
Write at least 150 words.
Zpráva v IELTS Task 1 potřebuje jeden hlavní odstavec pro každou skupinu fází. Nepište jeden odstavec pro každý krok. Rozdělte proces v jeho přirozených bodech, kde se mění místo, materiál nebo účel, aby každá skupina byla řadou fází, které na sebe navazují. Většina procesů dává dvě skupiny; krátký proces může mít jednu a dlouhý tři.
Vyberte skupiny.
Vytvořte skupiny
Vyberte skupiny.
- Group 1: stages 1 to 2 (Evaporation to Condensing Water Vapour). Group 2: stages 3 to 4 (Cloud Formation to Precipitation). Group 3: stages 5 to 6 (Surface Runoff to Groundwater).
- Group 1: stages 1 to 3 (Evaporation to Cloud Formation). Group 2: stages 4 to 5 (Precipitation to Surface Runoff). Group 3: stage 6 (Groundwater).
- Group 1: stages 1 to 3 (Evaporation to Cloud Formation). Group 2: stages 4 to 6 (Precipitation to Groundwater).
- Group 1: stages 1 to 2 (Evaporation to Condensing Water Vapour). Group 2: stages 3 to 5 (Cloud Formation to Surface Runoff). Group 3: stage 6 (Groundwater).
Přehled shrnuje celý proces na první pohled. Zeptejte se, kolik kroků proces má a jaké jsou hlavní fáze od začátku do konce. Proces se jen zřídka s něčím porovnává, proto popište tvar procesu, místo abyste hledali růst nebo pokles.
Odpovězte na otázky a najděte celkový trend.
Najděte celkový trend
Využijte poznámky z předchozího kroku. Přehled uvádí počet kroků a hlavní fáze a říká, zda proces končí produktem, nebo se opakuje jako cyklus. Vybavení, časy a teploty si nechte pro hlavní odstavce a neuvádějte důvody ani názory.
Napište jednu nebo dvě věty přehledu.
Napište přehled
Hlavní odstavec 1 popisuje první skupinu fází krok za krokem v pořadí, které ukazují šipky. Používejte trpné tvary jako is heated, is mixed a is poured, protože diagram jen zřídka říká, kdo práci provádí. Kroky spojujte výrazy pro pořadí jako first, then a after that.
Napište tři nebo čtyři věty pro hlavní odstavec 1.
Napište hlavní odstavec 1
Hlavní odstavec 2 popisuje vaši druhou skupinu fází. Navazuje přesně tam, kde skončil hlavní odstavec 1, takže se posloupnost nikdy nepřeruší. Dál používejte trpné tvary a skupiny propojte výrazy jako once a after this. Pokud je to poslední odstavec, označte konec výrazem in the final stage nebo finally, a pokud je proces cyklus, uveďte, že poslední krok vede zpět k prvnímu.
Napište tři nebo čtyři věty pro hlavní odstavec 2.
Napište hlavní odstavec 2
Vaše části nyní tvoří jednu zprávu: úvod, přehled a jeden hlavní odstavec pro každou skupinu fází. Přečtěte si je společně a zkontrolujte, že fáze jsou stále ve správném pořadí, že trpné tvary jsou správně a že je zpráva dostatečně dlouhá.
Přečtěte si celý plán zprávy a pak klikněte na Další a porovnejte ho se vzorovou zprávou.
Plán celé zprávy
Jak se rozhodnout
Úloha s diagramem procesu ukazuje krok za krokem, jak se něco vyrábí nebo jak funguje nějaký systém. Diagram má pevné pořadí, takže zpráva toto pořadí sleduje od první fáze po poslední.
Postupujte v pevném pořadí, aby fáze zůstaly ve správném sledu a žádný krok nechyběl.
- Přečtěte si graf. Spočítejte kroky a sledujte šipky, abyste viděli, kde proces začíná a kde končí.
- Napište úvod. Parafrázujte zadání úlohy a pojmenujte proces, bez jakýchkoli detailů.
- Vytvořte skupiny. Rozdělte fáze do skupin v přirozených bodech procesu, jeden hlavní odstavec pro každou skupinu.
- Najděte celkový trend. Určete, kolik kroků proces má a jaké jsou jeho hlavní fáze od začátku do konce.
- Napište přehled a hlavní odstavce. Nejdřív shrňte tvar procesu a pak popište kroky postupně.
- Plán celé zprávy. Přečtěte si své části společně a porovnejte je se vzorovou zprávou.
Zpráva o procesu se píše v trpném rodě. Diagram jen zřídka říká, kdo práci provádí, proto používejte tvary jako „is heated“, „is mixed“ a „is stored“ a kroky spojujte výrazy pro pořadí, například „first“, „after that“ a „finally“.
Čtěte
Diagram procesu ukazuje fáze spojené šipkami. Spočítejte kroky a sledujte šipky, abyste ověřili, kde proces začíná a kde končí. Pokud se poslední šipka vrací k první fázi, jde o cyklus a žádný konečný produkt neexistuje.
Úvod
Úvod říká, co diagram ukazuje. Zadání úlohy parafrázujte vlastními slovy, místo abyste ho opsali, a pojmenujte proces. Jednotlivé kroky do těchto vět nepatří.
Skupiny
Zpráva v Task 1 potřebuje jeden hlavní odstavec pro každou skupinu fází. Nepište samostatný odstavec ke každému kroku. Rozdělte proces v jeho přirozených bodech, kde se mění místo, materiál nebo účel, aby každou skupinu tvořila řada fází, které na sebe navazují. Většina procesů dává dvě skupiny; krátký proces může dát jednu a dlouhý tři.
Trend
Přehled shrnuje celý proces na první pohled: kolik má kroků a jaké jsou jeho hlavní fáze. Proces se jen zřídka s něčím porovnává, proto popište jeho tvar, místo abyste hledali růst nebo pokles.
Pište
Přehled je první a zůstává obecný, bez vybavení, časů a teplot. Každý hlavní odstavec pak popisuje své kroky v pořadí, které ukazují šipky. Používejte trpné tvary jako „is heated“ a „is poured“ a kroky spojujte výrazy pro pořadí, například „first“, „next“, „after that“ a „finally“.
Chcete-li se naučit zvládat procesní diagramy IELTS Academic Writing Task 1, zaregistrujte se k 7-denní bezplatné zkušební verzi pro přístup k lekci IELTS Academic Writing Task - Process Diagrams.
7-denní bezplatná zkušební verzeMapy
Pro tento typ otázky dostanete jednu, dvě nebo tři mapy.
Mapy mohou ukazovat město, ostrov nebo jinou geografickou oblast.
Mapy obvykle ukazují změny, které proběhly v oblasti za období času.
Změny se mohou vztahovat ke stavbě (např. rozvoj oblasti pro turistiku)
nebo zničení (např. jak byla oblast zasažena přírodní katastrofou, jako zemětřesením)
Vaším úkolem je napsat shrnutí změn, které proběhly, a pokrýt nejdůležitější body.
The maps below show the centre of a small town called Islip as it is now, and plans for its development. Summarise the information by selecting and reporting the main features, and make comparisons where relevant.
- Write at least 150 words.
- You should spend around 20 minutes on this task.
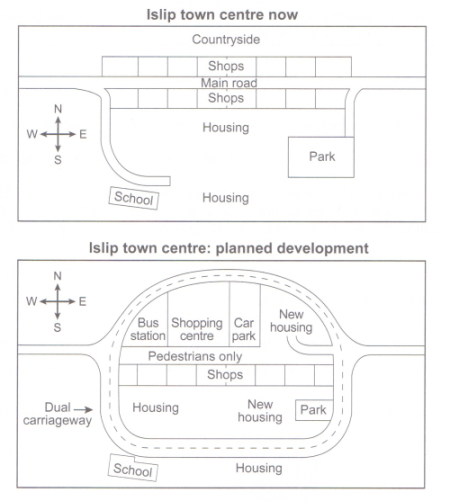
The diagrams illustrate some proposed changes to the central area of the town of Islip.
Overall, the principal change to the town will be the construction of a ring road around the centre. Various other developments with regard to shops and housing will accompany the building of this road.
As the first map reveals, lslip town center now is relatively small. There is a main road from the west to the east with shops on both sides. The northern area is rarely countryside, while the southern area is filled with houses with a school at the end of the fork road in the southwest corner and a park in the southeast area.
In the future, the main road is expected to reform into a dual carriageway as a round containing all the new buildings. The shops along the north side of the new pedestrian street will be demolished to make way for a bus station, shopping centre, car parks and new housing area. The shops along the south side of the street will remain, but it seems that the town's park will be reduced in size so that more new houses can be built within the ring road.
Map
Learn how to answer this question in a step-by-step interactive exercise
Map
Úloha s mapou v IELTS Academic Task 1 vám předloží dva nebo více plánů stejného místa v různých obdobích, obvykle dva. Napíšete zprávu o rozsahu alespoň 150 slov, která popisuje, jak se místo změnilo, a neuvádíte názory ani důvody.
Prohlédněte si zadání a pak klikněte na Další, abyste mohli pokračovat.
Prohlédněte si otázku
Write at least 150 words.
Začněte čtením map, ne psaním. Zkontrolujte, jaké místo je zobrazeno, jaká časová období se porovnávají a kolik map máte. Pak hledejte, co je nové, co zmizelo a co se nyní využívá k něčemu jinému.
Odpovězte na otázky k mapám.
Přečtěte si graf
Úvod parafrázuje zadání vlastními slovy. Uveďte, co mapy ukazují a jaké období zachycují, a formulaci zadání změňte, místo abyste ji opsali. Detaily, výrazy pro polohu a slovesa změny přijdou později.
Napište jednu nebo dvě věty, které parafrázují zadání.
Napište úvod
Zadání úlohy
The maps below show the centre of a small town called Islip as it is now, and plans for its development. Summarise the information by selecting and reporting the main features, and make comparisons where relevant.
Write at least 150 words.
Zpráva v Task 1 potřebuje jeden hlavní odstavec pro každou skupinu map. Obvykle tvoří každá mapa vlastní skupinu: starší mapa v prvním odstavci a novější ve druhém, protože tak zůstanou časová období oddělená. Dvě mapy, které se nejlépe popisují společně, mohou tvořit jednu skupinu, a tři mapy obvykle dávají tři odstavce.
Jeden odstavec pro každý prvek nebo pro každou polovinu mapy naruší srovnání mezi časovými obdobími.
Vyberte seskupení, které dá jasné hlavní odstavce.
Vytvořte skupiny
Vyberte seskupení, které dá jasné hlavní odstavce.
- One group: now and planned development.
- Group 1: now. Group 2: planned development.
Přehled uvádí největší změnu za celé období. Zeptejte se, zda se místo zvětšilo, nebo zmenšilo, a které druhy využití území přibyly nebo zmizely. Jednotlivé prvky a přesné polohy do přehledu nepatří.
Vyberte odpovědi, které popisují celkovou změnu.
Najděte celkový trend
Nyní napište přehled vlastními slovy s využitím poznámek z předchozího kroku. Stačí jedna nebo dvě věty. Popište celkový vývoj místa a vynechte přesné polohy, jednotlivé prvky i jakýkoli důvod změny.
Napište přehled v jedné nebo dvou větách.
Napište přehled
První hlavní odstavec podrobně popisuje mapu nebo mapy z vaší první skupiny. Pro stav, který už skončil, použijte minulé tvary a použijte výrazy pro polohu jako „to the north of“, „beside“ a „on the edge of“, aby čtenář dokázal každý prvek umístit. Popisujte prvky, ne důvody.
Napište tři nebo čtyři věty pro hlavní odstavec 1.
Napište hlavní odstavec 1
Druhý hlavní odstavec popisuje mapu nebo mapy z vaší druhé skupiny a změnu oproti starší mapě. Pro to, co bylo postaveno, odstraněno nebo nahrazeno, použijte trpné tvary, například „was built“, „had been cleared“ a „has been converted“, protože mapy neříkají, kdo práci provedl. Výrazy pro polohu stále ukazují, kde ke každé změně došlo.
Napište tři nebo čtyři věty pro hlavní odstavec 2.
Napište hlavní odstavec 2
Vaše části nyní tvoří jednu zprávu: úvod, přehled a jeden hlavní odstavec pro každou skupinu map. Přečtěte si je popořadě a zkontrolujte, že přehled podává celkový obraz a že hlavní odstavce nesou detaily.
Přečtěte si plán zprávy a pak ho porovnejte se vzorovou zprávou.
Plán celé zprávy
Jak se rozhodnout
Úloha s mapou vám dá dva nebo více plánků stejného místa v různých obdobích. Nepopisujete každý popisek. Popisujete, jak se místo mezi jednotlivými obdobími změnilo.
Postupujte v pevném pořadí, aby zpráva nejdřív uvedla celkový obraz a teprve pak detaily.
- Přečtěte si graf. Než začnete plánovat, zkontrolujte místo, období a hlavní prvky na každé mapě.
- Vytvořte skupiny. Rozdělte informace do skupin map, každou do jednoho hlavního odstavce, obvykle dřívější mapu jako první a pozdější po ní.
- Najděte celkový trend. Určete největší změnu za celé období, například růst, úbytek nebo nové využití území.
- Pište zprávu po částech. Napište úvod, pak přehled a pak jeden hlavní odstavec pro každou skupinu.
- Plán celé zprávy. Přečtěte si části společně a porovnejte je se vzorovou zprávou.
Zprávu o mapě nesou výrazy pro polohu a trpné tvary. Fráze jako „to the north of“ a „beside the river“ umisťují jednotlivé prvky a tvary jako „was built“ nebo „had been removed“ popisují změnu, aniž by jmenovaly, kdo práci provedl.
Čtěte
Než začnete plánovat, zkontrolujte, co mapy ukazují: místo, období a hlavní prvky na každé mapě. Pak hledejte, co je nové, co zmizelo a co se teď používá k něčemu jinému. Tato fáze čtení vám zabrání popsat jen jednu z map.
Skupiny
Zpráva v IELTS Task 1 potřebuje jeden hlavní odstavec pro každou skupinu map. Obvykle tvoří každá mapa vlastní skupinu, dřívější mapa jako první a pozdější po ní. Dvě mapy, které se nejlépe popisují společně, mohou tvořit jednu skupinu, a tři mapy obvykle dávají tři odstavce. Rozdělení si určete dřív, než začnete psát, protože určuje pořadí celé zprávy.
Přehled
Přehled uvádí největší změnu za celé období, ne drobný detail. Zeptejte se, zda se místo rozrostlo, nebo zmenšilo, a které druhy využití území se objevily nebo zmizely. Jednotlivé prvky a přesné polohy patří do hlavních odstavců.
Pište
Zpráva se staví v krátkých fázích. Úvod parafrázuje zadání, přehled uvádí hlavní změnu a jeden hlavní odstavec popisuje každou skupinu. Pro stav, který skončil, použijte minulé tvary, pro změny trpné tvary jako „was built“ nebo „had been cleared“ a výrazy pro polohu, které ukazují, kde každý prvek stojí.
Chcete-li se naučit zvládat mapy IELTS Academic Writing Task 1, zaregistrujte se k 7-denní bezplatné zkušební verzi pro přístup k lekci IELTS Academic Writing Task - Maps.
7-denní bezplatná zkušební verzeSmíšená data
V tomto typu úkolu dostanete dvě sady dat.
Data budou různých typů. Například jedna sada může být změna v čase a druhá sada statická.
Alternativně by jedna sada dat mohla ukazovat procento, zatímco druhá sada ukazuje čísla.
Můžete také dostat ilustraci (např. diagram nebo mapu) a sadu dat (např. sloupcový graf, spojnicový graf, koláčový graf nebo tabulku)
Vaším úkolem je shrnout obě sady dat.
The pie graph depicts the main reasons for the productivity loss of agricultural land worldwide. The table shows how these causes influenced three world regions during the 2000s.
Summarise the information by selecting and reporting the main features, and make comparisons where relevant.
Causes of Land Degradation by Region (%) | ||||
Region: | Deforestation | Over-cultivation | Over-grazing | Total land degraded |
North America | 0.3 | 3.4 | 1.7 | 5.4 |
Asia | 9.8 | 7.8 | 5.7 | 23.3 |
Australia & Oceania | 1.6 | 0.3 | 11 | 12.9 |
- Write at least 150 words.
- You should spend around 20 minutes on this task.
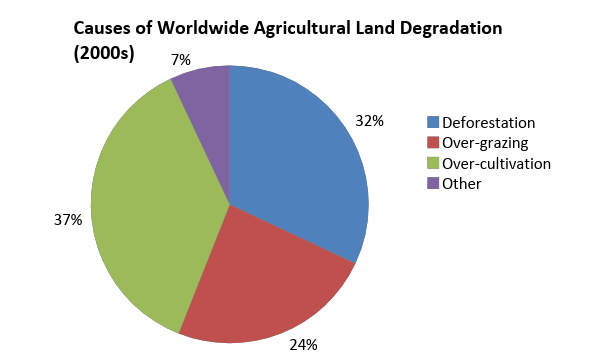
The pie chart shows the four main causes of farmland degradation in the world today, while the table presents the amount of land surface area affected by each one in three separate global regions during the 2000s.
Overall, Asia suffered more from the deterioration of farmland than other regions owing to deforestation and over-cultivation which were also the primary reasons for agricultural land loss worldwide.
Globally, 69% of degraded land is attributed to excessive cultivation and tree clearance, constituting 37% and 32% respectively. A further quarter of global land loss is due to over cultivation of crops. Other causes made up only 7% collectively.
In the 2000s, these causes affected regions of our planet differently. Asia was the worst affected where the top two causes of global land loss, deforestation and over-cultivation, resulted in 9.8% and 7.8% of degraded land there. The impact on Australia and Oceania was less severe though over-grazing was the predominant cause of land deterioration at eleven percent. The least affected of all was North America where only 5.4% of land was diminished, principally because of over-cultivation at 3.4%.
Mixed Charts
Learn how to answer this question in a step-by-step interactive exercise
Mixed Charts
Úloha s kombinovanými grafy v IELTS Academic Task 1 vám předloží dva nebo více vizuálů různého typu na jedno téma. Napíšete zprávu o rozsahu alespoň 150 slov, která uvádí hlavní rysy a propojuje jednotlivé vizuály, a neuvádíte názory ani důvody.
Prohlédněte si zadání a pak klikněte na Další, abyste mohli pokračovat.
Prohlédněte si otázku
Summarise the information by selecting and reporting the main features, and make comparisons where relevant.
Write at least 150 words.
Začněte čtením vizuálů, ne psaním. Zkontrolujte, co ukazuje každý vizuál, a než začnete plánovat, přečtěte si všechny popisky os a jednotky. Vizuály různého typu často měří různé věci, proto si poznamenejte, co mají společné, například stejnou skupinu lidí nebo stejné období.
Odpovězte na otázky k vizuálům.
Přečtěte si graf
Úvod parafrázuje zadání vlastními slovy. Ujasněte, co každý vizuál ukazuje a jakou skupinu a jaké období zachycuje, a formulaci zadání změňte, místo abyste ji opsali. Čísla a propojení mezi vizuály přijdou později.
Napište jednu nebo dvě věty, které parafrázují zadání.
Napište úvod
Zadání úlohy
The pie graph depicts the main reasons for the productivity loss of agricultural land worldwide. The table shows how these causes influenced three world regions during the 2000s.
Summarise the information by selecting and reporting the main features, and make comparisons where relevant.
Write at least 150 words.
Zpráva v Task 1 potřebuje jeden hlavní odstavec pro každou skupinu vizuálů a sada kombinovaných vizuálů dává jednu až tři skupiny. Vizuály stejného typu nebo stejného tématu patří k sobě, protože odstavec, který míchá dvě různá měřítka, se špatně sleduje. Dva koláčové grafy o stejné věci sdílejí odstavec a spojnicový graf s jiným měřítkem dostane vlastní.
Jeden odstavec pro každý vizuál může rozdělit, co patří k sobě, a jeden odstavec pro všechny vizuály míchá měřítka. Rozdělení podle let nebo podle nejvyšších a nejnižších čísel naruší srovnání, které zadání požaduje.
Vyberte seskupení, které dá každému odstavci jedno jasné měřítko.
Vytvořte skupiny
Vyberte seskupení, které dá každému odstavci jedno jasné měřítko.
- Group 1: the pie chart. Group 2: the table.
- One group: the pie chart and the table.
Přehled uvádí největší vzorec napříč všemi vizuály a přichází před jakýmikoli detaily. Najděte hlavní pohyb v každém vizuálu a pak rozhodněte, zda jeden vizuál druhý podporuje, nebo vysvětluje. Přesná čísla do přehledu nepatří.
Vyberte odpovědi, které popisují hlavní vzorec.
Najděte celkový trend
Nyní napište přehled vlastními slovy s využitím poznámek z předchozího kroku. Stačí jedna nebo dvě věty. Uveďte hlavní vzorec a spojení mezi vizuály a vynechte přesná čísla i jakýkoli důvod tohoto vzorce.
Napište přehled v jedné nebo dvou větách.
Napište přehled
První hlavní odstavec podrobně popisuje první skupinu. Uveďte významná srovnání, například nejvyšší bod, nejnižší bod a nejzřetelnější změnu, a každé z nich podložte několika vybranými čísly. Nevypisujte všechna čísla a nepopisujte zde ostatní skupiny.
Napište tři nebo čtyři věty pro hlavní odstavec 1.
Napište hlavní odstavec 1
Druhý hlavní odstavec popisuje druhou skupinu a propojuje ji s první. Seskupte srovnání, která patří k sobě, místo abyste procházeli kategorie jednu po druhé, a pomocí spojovacího výrazu ukažte, kde se vizuály shodují. Popisujte, co data ukazují, ne proč.
Napište tři nebo čtyři věty pro hlavní odstavec 2.
Napište hlavní odstavec 2
Vaše části nyní tvoří jednu zprávu: úvod, přehled a jeden hlavní odstavec pro každou skupinu vizuálů. Přečtěte si je popořadě a zkontrolujte, že přehled podává celkový obraz a že hlavní odstavce nesou detaily.
Přečtěte si plán zprávy a pak ho porovnejte se vzorovou zprávou.
Plán celé zprávy
Jak se rozhodnout
Úloha s kombinovanými grafy vám dá dva nebo více grafických podkladů různých typů na jedno téma. Nepíšete pro každý podklad samostatnou zprávu. Popisujete hlavní rysy každého z nich a propojujete je tam, kde spolu data souvisejí.
Postupujte v pevném pořadí, aby zpráva nejdřív uvedla celkový obraz a teprve pak detaily.
- Přečtěte si graf. Než začnete plánovat, zkontrolujte, co každý podklad ukazuje, a přečtěte si každou osu, popisek a jednotku.
- Vytvořte skupiny. Rozdělte podklady do jedné až tří skupin, každou do jednoho hlavního odstavce, obvykle s jedním typem grafu nebo jedním tématem v každé.
- Najděte celkový trend. Určete největší vzorec napříč všemi podklady a poznamenejte si, jak spolu souvisejí.
- Pište zprávu po částech. Napište úvod, pak přehled a pak jeden hlavní odstavec pro každou skupinu.
- Plán celé zprávy. Přečtěte si části společně a porovnejte je se vzorovou zprávou.
Seskupte významná srovnání, místo abyste vypisovali každé číslo. Několik vybraných čísel, která podporují vzorec, vám přinese víc než dlouhý výčet, který jen opakuje, co podklad už ukazuje.
Čtěte
Grafické podklady různých typů měří různé věci, proto si nejdřív přečtěte každý zvlášť. Zkontrolujte název, popisky os, jednotky a časový rámec a pak si poznamenejte, co mají podklady společné, například stejnou skupinu lidí nebo stejné období. Podíl času v koláčovém grafu a celkový součet ve spojnicovém grafu nejsou stejnou veličinou.
Skupiny
Zpráva v IELTS Task 1 potřebuje jeden hlavní odstavec pro každou skupinu grafických podkladů, takže podklady se musí rozdělit do jedné, dvou nebo tří skupin. Podklady stejného typu nebo stejného tématu patří k sobě a podklad, který měří něco jiného, dostane vlastní odstavec. Rozdělení si určete dřív, než začnete psát, protože určuje pořadí celé zprávy.
Přehled
Přehled uvádí v jedné nebo dvou větách největší vzorec napříč všemi podklady. Najděte hlavní vývoj v každém podkladu a pak rozhodněte, zda jeden podklad druhý podporuje nebo vysvětluje. Přesná čísla a jednotlivé kategorie patří do hlavních odstavců.
Pište
Zpráva se staví v krátkých fázích. Úvod parafrázuje zadání, přehled uvádí hlavní vzorec a jeden hlavní odstavec popisuje každou skupinu. V hlavních odstavcích seskupte srovnání, která patří k sobě, a každé podpořte několika vybranými čísly, místo abyste vypisovali každé číslo.
Chcete-li se naučit zvládat smíšená data IELTS Academic Writing Task 1, zaregistrujte se k 7-denní bezplatné zkušební verzi pro přístup k lekci IELTS Academic Writing Task - Mixed Data.
7-denní bezplatná zkušební verzeSlovní zásoba pro IELTS Academic Writing Task 1
Chcete-li získat vysoké skóre v tomto úkolu, musíte se naučit používat odpovídající slova a fráze pro prezentaci dat uvedených v koláčovém/sloupcovém/spojnicovém/smíšeném grafu. Doporučujeme zaregistrovat se k 7-denní bezplatné zkušební verzi a absolvovat následující lekce:
- IELTS Academic Writing Task 1 Lesson - How to write about numbers
- IELTS Academic Writing Task 1 Lesson - How to write about percentages
- IELTS Academic Writing Task 1 Lesson - How to write about changes in data
Vzorky IELTS Writing Task 1
Tato sekce poskytuje seznam vzorků IELTS writing pro IELTS Academic Writing Task 1.
- IELTS Academic Writing Task 1 - Line Chart Questions
- IELTS Academic Writing Task 1 - Bar Chart Questions
- IELTS Academic Writing Task 1 - Pie Chart Questions
- IELTS Academic Writing Task 1 - Map Questions
- IELTS Academic Writing Task 1 - Process Diagram Questions
- IELTS Academic Writing Task 1 - Mixed Data Questions
IELTS General Writing Task 1
V IELTS general training writing task 1, vám bude prezentována situace a budete muset napsat osobní odpověď ve formě neformálního, polo-formálního nebo formálního dopisu o nejméně 150 slovech. Situace, o kterých jste požádáni psát, jsou obyčejné, každodenní, jako:
- napsat zaměstnanci ubytování na vysoké škole o problémech s ubytováním,
- napsat novému zaměstnavateli o problémech s časovým hospodařením, které mají,
- napsat do místních novin o plánu rozvoje místního letiště,
- napsat do nájemní agentury k vyřešení problémů s topným systémem v jejich domě.
Ve vztahu k situaci dostanete informace ve formě tří bodů, které musíte zahrnout do své odpovědi. Možná budete muset požádat nebo poskytnout informace a/nebo vysvětlit situaci. Abyste to udělali, možná budete muset udělat jedno z následujícího:
- požádat a/nebo poskytnout obecné faktické informace,
- vyjádřit potřeby, přání, preference nebo nelibosti,
- vyjádřit názory nebo stížnosti,
- podávat žádosti nebo dělat návrhy/doporučení.
Styl IELTS General Writing
Styl psaní, který budete používat, závisí na komu jste požádáni psát (tj. publikum) a jak dobře je máte znát. Musíte psát ve stylu, který odpovídá vašemu publiku a který vám pomůže dosáhnout účelu vašeho psaní, například psaní příteli (neformální) nebo psaní manažerovi (polo-formální nebo formální). Nemusíte zahrnout žádné adresy na začátku svých dopisů.
Jak se vyhnout ztrátě bodů v IELTS General Writing Task 1
Jak již bylo zmíněno, nestrávte více než 20 minut na tomto úkolu a ujistěte se, že napíšete alespoň 150 slov, jinak budete penalizováni. Ačkoli nebudete penalizováni za napsání více než 150 slov, měli byste mít na paměti, že delší odpověď na task 1 může znamenat, že máte méně času na task 2, který přispívá dvakrát více k vašemu celkovému band score Writing.
Měli byste si také pamatovat, že budete penalizováni za irelevantnost, pokud je odpověď mimo téma nebo není napsána jako úplný, propojený text (např. použití odrážek v jakékoli části odpovědi nebo formě poznámek apod.). Budete silně penalizováni za plagiátorství (tj. kopírování z jiného zdroje).
Last weekend, your cousin celebrated her 50th birthday, but you couldn't attend and you forgot to cancel.
Write a letter to your cousin. In your letter:
- Apologize for missing the birthday celebration
- Explain why you missed it and why you hadn't let her know
- Describe how you will make it up to her
You do NOT need to write any addresses.
Begin your letter as follows:
Dear ___,
- Write at least 150 words.
- You should spend around 20 minutes on this task.
Dear Marnie,
Happy belated birthday! I hope you're doing well and that you had a great 50th birthday party.
I'm so sorry that I wasn't at your party to celebrate with you. It's been such a long time since we've been able to catch up and see each other.
To be completely honest, I've been swamped with work lately, and I was asked to go on a last-minute business trip a few days before your birthday. I was so busy that I had completely forgotten about your party, and it didn't occur to me to call you and cancel.
My busy schedule is absolutely not an excuse for missing your 50th birthday, though, and I would love to make it up to you. I've reserved a table for two next Friday night at the new sushi restaurant in town. Can I please treat you to a luxurious birthday dinner?
I hope we can celebrate together next Friday!
Speak to you soon,
Jessica
Total Word Count: 162 words

Task Achievement — Letter
Learn how to answer this question in a step-by-step interactive exercise
Task Achievement — Letter
V IELTS General Training Task 1 píšete dopis, který reaguje na určitou situaci. Hodnocení Splnění úkolu (Task Achievement) závisí na tom, zda pokryjete každý bod zadání, protože i silný dopis, který jeden bod vynechá, ztrácí body.
Přečtěte si situaci, body zadání a případnou úvodní větu, kterou vám úloha dává.
Prohlédněte si zadání a pak klikněte na Další, abyste mohli pokračovat.
Prohlédněte si otázku
Write a letter to your cousin. In your letter:
- Apologize for missing the birthday celebration
- Explain why you missed it and why you hadn't let her know
- Describe how you will make it up to her
Write at least 150 words. You do NOT need to write any addresses.
Begin your letter as follows:
Dear ___,
Než začnete psát, naplánujte dopis tak, že odpovíte na tři otázky. Komu píšete, proč píšete a co musí dopis obsahovat?
Adresát určuje, jak formální má jazyk být, účel určuje, jak začnete, a body zadání určují obsah. Každá odpověď už je někde v zadání.
Přiřaďte každou plánovací otázku k části zadání, která na ni odpovídá.
Pochopte zadání
Přiřaďte každou plánovací otázku k části zadání, která na ni odpovídá.
Oslovení a závěrečný pozdrav čtenáři říkají, jak formální dopis je, proto musí odpovídat osobě, které píšete. Dopis cizímu člověku nebo vedoucímu je formální, dopis kamarádovi je neformální.
Držte oba konce dopisu na stejné úrovni. Formální oslovení, po kterém následuje ledabylý pozdrav, čtenáře mate.
Vyberte oslovení a závěrečný pozdrav, které se hodí k adresátovi.
Vyberte oslovení a závěrečnou formuli
Confirm the greeting
- Dear ___,
- Dear Sir or Madam,
- Dear Ms. Smith,
- Hey you,
Choose a closing
- Speak to you soon,
- Lots of love,
- Best wishes,
- Yours faithfully,
- Yours sincerely,
Dejte prvnímu bodu zadání vlastní odstavec. Splnění úkolu se hodnotí podle toho, zda je každý bod pokrytý a rozvedený, ne jen zmíněný.
K dispozici máte úvodní fráze, kterými můžete větu začít. Myšlenku dokončete vlastními slovy a držte stejný tón jako v oslovení.
Napište odstavec, který pokrývá první bod zadání.
Napište bod 1 ze zadání
Apologise for missing the birthday celebration
Druhý bod zadání také potřebuje vlastní odstavec. Dejte mu stejnou délku a stejné množství detailů jako prvnímu, protože bod, na který odpovíte jen napůl, vás stále stojí body.
Začněte úvodní frází a pak doplňte detaily, které by čtenář v této situaci skutečně potřeboval.
Napište odstavec, který pokrývá druhý bod zadání.
Napište bod 2 ze zadání
Explain why you missed it and did not let her know
Dokončete hlavní část dopisu třetím bodem zadání. Jakmile jsou všechny tři pokryté celými větami, je úkol splněn.
Držte tón až do konce stejný a zkontrolujte, že tento odstavec odpovídá na to, na co se bod zadání skutečně ptal.
Napište odstavec, který pokrývá třetí bod zadání.
Napište bod 3 ze zadání
Describe how you will make it up to her
Vaše odstavce se nyní zobrazují společně jako jeden dopis s oslovením a závěrečným pozdravem na svém místě. Přečtěte si ho jako jeden celek a zkontrolujte, že je pokryt každý bod zadání.
Porovnejte své formulace s ukázkovým dopisem a všimněte si, jak tón zůstává stejný od oslovení až po závěrečný pozdrav.
Projděte si dopis a pak klikněte na Další, abyste mohli pokračovat.
Zkontrolujte celý dopis
Jak se rozhodnout
Dopis v Task 1 reaguje na situaci a pokrývá zadané odrážky. Splnění úkolu závisí na tom, zda pokryjete všechny odrážky a přizpůsobíte tón adresátovi.
Postupujte v pevném pořadí, aby žádná odrážka nechyběla a míra formálnosti zůstala stejná v celém dopise.
- Pochopte zadání. Ujasněte si, komu píšete, proč píšete a co musí dopis obsahovat.
- Vyberte oslovení a závěrečnou formuli. Přizpůsobte oslovení i závěrečnou formuli adresátovi a držte obojí na stejné úrovni formálnosti.
- Napište body ze zadání. Každé odrážce dejte vlastní odstavec a rozviňte ji skutečnými detaily.
- Zkontrolujte celý dopis. Přečtěte si odstavce společně a zkontrolujte, že je pokrytá každá odrážka.
Ke každé odrážce napište jeden odstavec. Díky tomuto jednoduchému plánu je téměř nemožné nějakou odrážku vynechat, a právě vynechaná odrážka je nejrychlejší cesta ke ztrátě bodů za splnění úkolu.
Plán
Celý dopis naplánujete pomocí tří otázek. Komu píšete, proč píšete a co musí dopis obsahovat? Každá odpověď už je někde v zadání.
Tón
Oslovení a závěrečná formule ukazují adresátovi, jak formální dopis je. Dopis cizímu člověku nebo nadřízenému je formální, dopis kamarádovi je neformální a začátek i konec dopisu musí zůstat na stejné úrovni.
Odrážky
Každá odrážka dostane vlastní odstavec. Pokryjte ji celými větami s detaily, které by adresát skutečně potřeboval, a dejte odstavcům podobnou délku, aby žádný bod nepůsobil uspěchaně.
Pro více informací o IELTS General Writing Task 1 se podívejte na The Ultimate Guide for the IELTS General Writing Task 1
IELTS Writing Task 2
V IELTS writing task 2 budete muset napsat esej v tradičním stylu jako odpověď na otázku. Musíte napsat alespoň 250 slov. Pokud nenapíšete dostatek slov, budete penalizováni. V task 2 je 6 různých typů otázek. Pojďme se podívat na příklady otázek a vzorové eseje pro každý typ eseje.
Příčiny a důsledky
V tomto typu otázky dostanete problém nebo situaci. Vaším úkolem je popsat příčiny situace a některé důsledky situace.
It is observed that in many countries not enough students are choosing to study science at university. What are the causes? And what will be the effects on society?
- Write at least 250 words.
- You should spend around 40 minutes on this task.
It is a fact that many students globally are avoiding science in favor of other subjects at university. Such a trend is largely due to how science is perceived, which may be having a detrimental effect on a nation’s development.
The primary reason for the drop in enrollment in science-based courses is that many undergraduates are put off by their difficulty. While many high school students enjoy science, they soon find themselves facing a lot of theory and research based courses once in college. For example according to a recent poll of UK universities, many students stated that while science was interesting in high school, there was too much theory learnt in classes, and not enough application in the lab to make it interesting. Furthermore, there are plenty of easier alternatives such as humanities for students to choose from these days. As a result, most choose a more appealing humanities degree over a science one.
Countries with the lowest science enrollment rates are affected the most competitively and economically. Fewer science graduates mean a shortage of skilled researchers in science-related fields like bio-engineering which reduces a countries competitiveness in attracting foreign investment. In other words foreign companies are usually unwilling to invest in nations with a low pool of skilled workers. In addition, a low number of skilled workers mean fewer technological developments for such countries, which may cause their economies to suffer from lost business in being the first to market with new products. For example, evidence shows that the number of patents filed by Chinese corporations is beginning to threaten the number credited to American ones.
In conclusion, there is a direct correlation between the perceived difficulty of science degrees and limited economic growth. Only by changing this attitude will countries reverse this trend.
Task Achievement — Task 2
Learn how to answer this question in a step-by-step interactive exercise
Task Achievement — Task 2
V IELTS Writing Task 2 píšete esej, která odpovídá na všechny části otázky. Pozorně si přečtěte tvrzení a řádek s pokynem a všimněte si, o čem vás otázka žádá diskutovat.
Esej, která se drží tématu, ale nikdy neodpoví na položenou otázku, nemůže dosáhnout vysokého skóre (band).
Prohlédněte si otázku a pak klikněte na Další, abyste mohli pokračovat.
Prohlédněte si otázku
Napišme úvod ve dvou větách, celkem asi 25 až 35 slov. Nejprve přepište otázku vlastními slovy. Parafrázujte otázku pomocí vlastních slov a synonym. Tak zajistíte, že se esej bude držet tématu, a zároveň můžete ukázat širokou slovní zásobu. Druhá věta představí konkrétní témata, kterými se budete zabývat v hlavních odstavcích.
Napište úvod.
Napište úvod
Každý hlavní odstavec potřebuje tematickou větu, která představí jeho hlavní bod. Pro esej této délky stačí dva hlavní odstavce.
Pro každý odstavec napište jednu jasnou větu. Každá věta by měla mít 12 až 20 slov; vysvětlení a příklady si nechte na další kroky.
Napište jednu tematickou větu pro každý hlavní odstavec.
Napište dvě tematické věty
science courses are seen as too hard
fewer scientists hurt the economy
Tematická věta získá body, jen když je podložená. Rozviňte první hlavní odstavec pomocí dvou bodů. U každého bodu napište vysvětlení a konkrétní příklad.
Každý hlavní odstavec by měl mít asi 4–5 vět, tedy 60 až 80 slov. Konkrétní situace je silnější než obecné tvrzení.
Dopište zbytek prvního hlavního odstavce.
Rozviňte hlavní odstavec 1
60
Dejte druhému hlavnímu odstavci stejnou hloubku jako prvnímu. Použijte dva body a každý podložte vysvětlením a příkladem.
Každý hlavní odstavec by měl mít asi 4–5 vět, tedy 60 až 80 slov. Neopakujte první odstavec jinými slovy.
Dopište zbytek druhého hlavního odstavce.
Rozviňte hlavní odstavec 2
60
Závěr esej uzavírá. Napište shrnutí hlavních bodů ve dvou větách a pak přidejte jednu nebo dvě věty o tom, proč je téma důležité.
Neopisujte úvod a nepřidávejte nový argument. Celý závěr by měl mít 35 až 50 slov.
Napište závěr o 3–4 větách.
Napište závěr
35
Váš úvod, tematické věty, hlavní odstavce a závěr se nyní zobrazují společně jako jedna esej. Přečtěte si ji jako jeden celek a zkontrolujte, že odpovídá na všechny části otázky.
Porovnejte své formulace s ukázkovou esejí a všimněte si, že každý odstavec plní jinou úlohu.
Projděte si esej a pak klikněte na Další, abyste mohli pokračovat.
Zkontrolujte celou esej
Jak se rozhodnout
Esej v Task 2 odpovídá na všechny části otázky. Splnění úkolu závisí na tom, zda pokryjete, na co se otázka ptá, a každý hlavní bod podpoříte vysvětlením a příkladem.
Postupujte v pevném pořadí: úvod, dvě tematické věty, dva rozvinuté hlavní odstavce a pak závěr.
- Napište úvod.
Obecně budete pro tento odstavec potřebovat dvě věty. Parafrázujte otázku vlastními slovy a pomocí synonym. Díky tomu se vaše esej drží tématu a můžete ukázat širokou slovní zásobu. Druhá věta představí konkrétní témata, kterými se budete zabývat v hlavních odstavcích. Váš úvod by proto měl obsahovat:
- Přeformulovanou otázku
- Představení konkrétních témat
- Napište dvě tematické věty. Pro každý hlavní odstavec napište jednu tematickou větu.
- Rozviňte hlavní odstavce. Každý hlavní odstavec podpořte dvěma body a ke každému bodu dejte vysvětlení a příklad. Každý hlavní odstavec by měl mít zhruba 4–5 vět.
- Napište závěr. Shrňte hlavní body a pak řekněte, proč je téma důležité.
- Zkontrolujte celou esej. Přečtěte si části společně a zkontrolujte, že jste odpověděli na všechny části otázky.
Dva rozvinuté odstavce získají víc bodů než čtyři nerozvinuté body. Examinátoři odměňují podporu, proto raději přidejte vysvětlení a příklad k bodu, který už máte, než abyste přidávali další bod.
Úvod
Obecně budete pro tento odstavec potřebovat dvě věty. Parafrázujte otázku vlastními slovy a pomocí synonym. Díky tomu se vaše esej drží tématu a můžete ukázat širokou slovní zásobu. Druhá věta představí konkrétní témata, kterými se budete zabývat v hlavních odstavcích. Váš úvod by proto měl obsahovat:
- Přeformulovanou otázku
- Představení konkrétních témat
Tematické věty
Pro každý hlavní odstavec napište jednu tematickou větu. Každá věta by měla představit hlavní bod svého odstavce ve 12 až 20 slovech a příklady si nechat na další fázi.
Podpora
Tematická věta získává body, až když je podpořená. Vysvětlete, proč bod platí, uveďte konkrétní příklad a oběma hlavním odstavcům dejte stejně silnou podporu. Každý hlavní odstavec by měl mít zhruba 4–5 vět.
Závěr
Závěr shrne hlavní body ve dvou větách a pak přidá jednu nebo dvě věty o tom, proč je téma důležité. Neopisujte úvod a nepřidávejte nový argument.
Diskutujte oba pohledy a podejte vlastní názor
V tomto typu otázky dostanete dva protikladné pohledy související s problémem. Obvykle budou tyto dva pohledy v oddělených větách, spojených přechodovým slovem, jako je "however", aby naznačily, že se tyto dva pohledy liší. Vaším úkolem je napsat diskursivní esej, kontrastující obě strany problému a poskytující vlastní názor.
Some people argue that the public should be allowed to have guns. Others do not agree. Discuss both points of view and give your opinion.
- Write at least 250 words.
- You should spend around 40 minutes on this task.
Gun ownership is a controversial topic with some people arguing that the public should have the choice to own them, while others disagree wholeheartedly with the idea. In my opinion, I believe that the public should only be entitled to own guns after having proper training.
The benefits of gun ownership are touted in some countries more than others. In countries where owning one is a civic right, like the United States, it is legal to use one in self-defense is legal. With muggings, murder and burglary rising in many countries, there may be some truth to the claim that owing a gun gives the owner increased security. Furthermore, in remote or dangerous areas, guns may be a necessity rather than an option. Without police nearby, properly stored, guns may be a great asset in deterring criminals from breaking and entering a remote property.
However, rather than deter violence, guns tend to escalate it in areas where they are widely available. Research shows that violent crime increases dramatically when guns are prevalent in society. When the public is armed, criminals and the police become so too, creating a situation in which guns beget more guns and eventually death. Additionally, greater ease of access is dangerous for children. Having a gun easily accessible may tempt children to abuse them as evidenced by the almost weekly school shootings in the US. There is further a proven link between increased suicide rates when guns are present.
It is my belief that the general public should be barred from owning guns of any kind. Also, guns should be restricted to specialists with a proven need for a firearm such as soldiers or hunters. While there are certain circumstances where owning a gun is an advantage, in the vast majority of situations there is no place for a gun in modern society.
Task Achievement — Task 2
Learn how to answer this question in a step-by-step interactive exercise
Task Achievement — Task 2
V IELTS Writing Task 2 píšete esej, která odpovídá na všechny části otázky. Pozorně si přečtěte tvrzení a řádek s pokynem a všimněte si, o čem vás otázka žádá diskutovat.
Esej, která se drží tématu, ale nikdy neodpoví na položenou otázku, nemůže dosáhnout vysokého skóre (band).
Prohlédněte si otázku a pak klikněte na Další, abyste mohli pokračovat.
Prohlédněte si otázku
Napišme úvod ve dvou větách, celkem asi 25 až 35 slov. Nejprve přepište otázku vlastními slovy. Parafrázujte otázku pomocí vlastních slov a synonym. Tak zajistíte, že se esej bude držet tématu, a zároveň můžete ukázat širokou slovní zásobu. Druhá věta představí konkrétní témata, kterými se budete zabývat v hlavních odstavcích.
Napište úvod.
Napište úvod
Každý hlavní odstavec potřebuje tematickou větu, která představí jeho hlavní bod. Pro esej této délky stačí dva hlavní odstavce.
Pro každý odstavec napište jednu jasnou větu. Každá věta by měla mít 12 až 20 slov; vysvětlení a příklady si nechte na další kroky.
Napište jednu tematickou větu pro každý hlavní odstavec.
Napište dvě tematické věty
guns help people defend themselves
more guns lead to more violence
Tematická věta získá body, jen když je podložená. Rozviňte první hlavní odstavec pomocí dvou bodů. U každého bodu napište vysvětlení a konkrétní příklad.
Každý hlavní odstavec by měl mít asi 4–5 vět, tedy 60 až 80 slov. Konkrétní situace je silnější než obecné tvrzení.
Dopište zbytek prvního hlavního odstavce.
Rozviňte hlavní odstavec 1
60
Dejte druhému hlavnímu odstavci stejnou hloubku jako prvnímu. Použijte dva body a každý podložte vysvětlením a příkladem.
Každý hlavní odstavec by měl mít asi 4–5 vět, tedy 60 až 80 slov. Neopakujte první odstavec jinými slovy.
Dopište zbytek druhého hlavního odstavce.
Rozviňte hlavní odstavec 2
60
Závěr esej uzavírá. Napište shrnutí hlavních bodů ve dvou větách a pak přidejte jednu nebo dvě věty o tom, proč je téma důležité.
Neopisujte úvod a nepřidávejte nový argument. Celý závěr by měl mít 35 až 50 slov.
Napište závěr o 3–4 větách.
Napište závěr
35
Váš úvod, tematické věty, hlavní odstavce a závěr se nyní zobrazují společně jako jedna esej. Přečtěte si ji jako jeden celek a zkontrolujte, že odpovídá na všechny části otázky.
Porovnejte své formulace s ukázkovou esejí a všimněte si, že každý odstavec plní jinou úlohu.
Projděte si esej a pak klikněte na Další, abyste mohli pokračovat.
Zkontrolujte celou esej
Jak se rozhodnout
Esej v Task 2 odpovídá na všechny části otázky. Splnění úkolu závisí na tom, zda pokryjete, na co se otázka ptá, a každý hlavní bod podpoříte vysvětlením a příkladem.
Postupujte v pevném pořadí: úvod, dvě tematické věty, dva rozvinuté hlavní odstavce a pak závěr.
- Napište úvod.
Obecně budete pro tento odstavec potřebovat dvě věty. Parafrázujte otázku vlastními slovy a pomocí synonym. Díky tomu se vaše esej drží tématu a můžete ukázat širokou slovní zásobu. Druhá věta představí konkrétní témata, kterými se budete zabývat v hlavních odstavcích. Váš úvod by proto měl obsahovat:
- Přeformulovanou otázku
- Představení konkrétních témat
- Napište dvě tematické věty. Pro každý hlavní odstavec napište jednu tematickou větu.
- Rozviňte hlavní odstavce. Každý hlavní odstavec podpořte dvěma body a ke každému bodu dejte vysvětlení a příklad. Každý hlavní odstavec by měl mít zhruba 4–5 vět.
- Napište závěr. Shrňte hlavní body a pak řekněte, proč je téma důležité.
- Zkontrolujte celou esej. Přečtěte si části společně a zkontrolujte, že jste odpověděli na všechny části otázky.
Dva rozvinuté odstavce získají víc bodů než čtyři nerozvinuté body. Examinátoři odměňují podporu, proto raději přidejte vysvětlení a příklad k bodu, který už máte, než abyste přidávali další bod.
Úvod
Obecně budete pro tento odstavec potřebovat dvě věty. Parafrázujte otázku vlastními slovy a pomocí synonym. Díky tomu se vaše esej drží tématu a můžete ukázat širokou slovní zásobu. Druhá věta představí konkrétní témata, kterými se budete zabývat v hlavních odstavcích. Váš úvod by proto měl obsahovat:
- Přeformulovanou otázku
- Představení konkrétních témat
Tematické věty
Pro každý hlavní odstavec napište jednu tematickou větu. Každá věta by měla představit hlavní bod svého odstavce ve 12 až 20 slovech a příklady si nechat na další fázi.
Podpora
Tematická věta získává body, až když je podpořená. Vysvětlete, proč bod platí, uveďte konkrétní příklad a oběma hlavním odstavcům dejte stejně silnou podporu. Každý hlavní odstavec by měl mít zhruba 4–5 vět.
Závěr
Závěr shrne hlavní body ve dvou větách a pak přidá jednu nebo dvě věty o tom, proč je téma důležité. Neopisujte úvod a nepřidávejte nový argument.
Výhody a nevýhody
V tomto typu otázky budete požádáni, abyste prodiskutovali pozitivní a negativní aspekty situace, rozhodnutí nebo trendu. Možná budete také požádáni, abyste poskytli svůj názor o tom, kterou stranu považujete za důležitější.
In some countries, governments are encouraging industries and businesses to move to regional areas outside the big cities. Do the advantages of this trend outweigh the disadvantages?
- Write at least 250 words.
- You should spend around 40 minutes on this task.
There is a movement among some countries to promote regional areas away from cities as attractive to business and industry. In my opinion, I consider relocation of business to bring about more drawbacks than benefits over the long term.
There are several attractive benefits to businesses moving to regional areas. For businesses rural locations mean lower land prices. Cheaper land allows large or small business equal prospects to become established cheaply with additional room to expand. As an example, the average size of a business in UK cities is currently 25 square meters while those in the rural locales average around 50m2. Additionally, countries benefits principally from the direct investment in underperforming parts of the country. Having companies operating in less urbanized areas, creates jobs, attracts talent and increases immigration which brings greater wealth.
On the other hand, relocation is not without its drawbacks. For one thing, locations away from population centers may mean a greater distance to market for goods. As a result, cost savings from cheaper land may be mitigated by the increased transportation costs of shipping products to customers. For another thing, there are often fewer skilled workers in regional areas. It may not be easy to attract employees to work in out-of-the-way places, which would mean longer commutes for staff from nearby cities at the expense of the company coffers. Lastly, increased business in country areas, disturbs the life of local residents. Country roads are not built for heavy trucks or traffic which may cause increased noise, congestions and inconvenience to those living nearby.
To sum up, while regional settings may be well suited to certain internet-based businesses, for more traditional companies, the distance from the city presents many challenges to overcome.
Task Achievement — Task 2
Learn how to answer this question in a step-by-step interactive exercise
Task Achievement — Task 2
V IELTS Writing Task 2 píšete esej, která odpovídá na všechny části otázky. Pozorně si přečtěte tvrzení a řádek s pokynem a všimněte si, o čem vás otázka žádá diskutovat.
Esej, která se drží tématu, ale nikdy neodpoví na položenou otázku, nemůže dosáhnout vysokého skóre (band).
Prohlédněte si otázku a pak klikněte na Další, abyste mohli pokračovat.
Prohlédněte si otázku
Napišme úvod ve dvou větách, celkem asi 25 až 35 slov. Nejprve přepište otázku vlastními slovy. Parafrázujte otázku pomocí vlastních slov a synonym. Tak zajistíte, že se esej bude držet tématu, a zároveň můžete ukázat širokou slovní zásobu. Druhá věta představí konkrétní témata, kterými se budete zabývat v hlavních odstavcích.
Napište úvod.
Napište úvod
Každý hlavní odstavec potřebuje tematickou větu, která představí jeho hlavní bod. Pro esej této délky stačí dva hlavní odstavce.
Pro každý odstavec napište jednu jasnou větu. Každá věta by měla mít 12 až 20 slov; vysvětlení a příklady si nechte na další kroky.
Napište jednu tematickou větu pro každý hlavní odstavec.
Napište dvě tematické věty
cheaper land and new jobs in the regions
higher transport costs and fewer skilled workers
Tematická věta získá body, jen když je podložená. Rozviňte první hlavní odstavec pomocí dvou bodů. U každého bodu napište vysvětlení a konkrétní příklad.
Každý hlavní odstavec by měl mít asi 4–5 vět, tedy 60 až 80 slov. Konkrétní situace je silnější než obecné tvrzení.
Dopište zbytek prvního hlavního odstavce.
Rozviňte hlavní odstavec 1
60
Dejte druhému hlavnímu odstavci stejnou hloubku jako prvnímu. Použijte dva body a každý podložte vysvětlením a příkladem.
Každý hlavní odstavec by měl mít asi 4–5 vět, tedy 60 až 80 slov. Neopakujte první odstavec jinými slovy.
Dopište zbytek druhého hlavního odstavce.
Rozviňte hlavní odstavec 2
60
Závěr esej uzavírá. Napište shrnutí hlavních bodů ve dvou větách a pak přidejte jednu nebo dvě věty o tom, proč je téma důležité.
Neopisujte úvod a nepřidávejte nový argument. Celý závěr by měl mít 35 až 50 slov.
Napište závěr o 3–4 větách.
Napište závěr
35
Váš úvod, tematické věty, hlavní odstavce a závěr se nyní zobrazují společně jako jedna esej. Přečtěte si ji jako jeden celek a zkontrolujte, že odpovídá na všechny části otázky.
Porovnejte své formulace s ukázkovou esejí a všimněte si, že každý odstavec plní jinou úlohu.
Projděte si esej a pak klikněte na Další, abyste mohli pokračovat.
Zkontrolujte celou esej
Jak se rozhodnout
Esej v Task 2 odpovídá na všechny části otázky. Splnění úkolu závisí na tom, zda pokryjete, na co se otázka ptá, a každý hlavní bod podpoříte vysvětlením a příkladem.
Postupujte v pevném pořadí: úvod, dvě tematické věty, dva rozvinuté hlavní odstavce a pak závěr.
- Napište úvod.
Obecně budete pro tento odstavec potřebovat dvě věty. Parafrázujte otázku vlastními slovy a pomocí synonym. Díky tomu se vaše esej drží tématu a můžete ukázat širokou slovní zásobu. Druhá věta představí konkrétní témata, kterými se budete zabývat v hlavních odstavcích. Váš úvod by proto měl obsahovat:
- Přeformulovanou otázku
- Představení konkrétních témat
- Napište dvě tematické věty. Pro každý hlavní odstavec napište jednu tematickou větu.
- Rozviňte hlavní odstavce. Každý hlavní odstavec podpořte dvěma body a ke každému bodu dejte vysvětlení a příklad. Každý hlavní odstavec by měl mít zhruba 4–5 vět.
- Napište závěr. Shrňte hlavní body a pak řekněte, proč je téma důležité.
- Zkontrolujte celou esej. Přečtěte si části společně a zkontrolujte, že jste odpověděli na všechny části otázky.
Dva rozvinuté odstavce získají víc bodů než čtyři nerozvinuté body. Examinátoři odměňují podporu, proto raději přidejte vysvětlení a příklad k bodu, který už máte, než abyste přidávali další bod.
Úvod
Obecně budete pro tento odstavec potřebovat dvě věty. Parafrázujte otázku vlastními slovy a pomocí synonym. Díky tomu se vaše esej drží tématu a můžete ukázat širokou slovní zásobu. Druhá věta představí konkrétní témata, kterými se budete zabývat v hlavních odstavcích. Váš úvod by proto měl obsahovat:
- Přeformulovanou otázku
- Představení konkrétních témat
Tematické věty
Pro každý hlavní odstavec napište jednu tematickou větu. Každá věta by měla představit hlavní bod svého odstavce ve 12 až 20 slovech a příklady si nechat na další fázi.
Podpora
Tematická věta získává body, až když je podpořená. Vysvětlete, proč bod platí, uveďte konkrétní příklad a oběma hlavním odstavcům dejte stejně silnou podporu. Každý hlavní odstavec by měl mít zhruba 4–5 vět.
Závěr
Závěr shrne hlavní body ve dvou větách a pak přidá jednu nebo dvě věty o tom, proč je téma důležité. Neopisujte úvod a nepřidávejte nový argument.
Problémy a řešení
V tomto typu otázky dostanete problém nebo situaci. Vaším úkolem je popsat příčiny situace a některé řešení problému. Otázka může požádat o obecná řešení (např. jak by mohl být tento problém vyřešen) nebo zeptat se, jak konkrétní skupiny mohou problém vyřešit (např. jaké kroky mohou vlády a jednotlivci podniknout k řešení problému?). Nemusíte podrobně zmiňovat dopady, jen krátce.
More and more wild animals are on the verge of extinction and others are on the endangered list. What are the reasons for this? What can be done to solve this problem?
- Write at least 250 words.
- You should spend around 40 minutes on this task.
The number of critically endangered animals is growing significantly, while a disturbing number of other species have become threatened. This worrying trend stems from several causes, though solutions exist where the will to implement them is present.
Regarding species on the critically endangered list, outmoded beliefs in Eastern medicine that endangered animal parts have medicinal qualities is driving demand for them, particularly in China. Animals are needlessly killed to cure ailments from infertility to arthritis, and China’s increasing affluence mean demand is expected to increase even further. Despite this, limited action by governments has proven ineffective at stopping such a trade. Many species threatened with extinction live in national parks, typically in developing countries. However, chronic underfunding means officials there are powerless to catch poachers, and corruption means the ones who are caught, often get away.
Where political will is available, several solutions may help. To begin with, developed countries could help fund budgets to protect endangered species in poorer countries. While this doesn’t solve the issue of corruption, it would increase deterrence and hopefully reduce the number of animals needlessly killed. More meaningfully, in countries where animal parts are bought and sold, laws should be more strictly enforced and punishments massively increased to discourage both sellers and buyers alike. A concerted education campaign should also be effected to stamp out the perception that animal parts have any curative properties to reduce the market for such ‘goods’ once and for all.
In conclusion, removing the market for animal parts, and better protecting the endangered animals that remain may help preserve the world’s natural heritage before it is too late.
Further reasons to consider:
Development destroying their habitat and food sourceGrowing cities and farmland encroach on habitatMany animals cannot find the place to raise their youngFurther solutions to consider:
Increase government budgets to protect animalsFor example, the panda is now rebounding in Southern China due to concerted government efforts to protect it.Task Achievement — Task 2
Learn how to answer this question in a step-by-step interactive exercise
Task Achievement — Task 2
V IELTS Writing Task 2 píšete esej, která odpovídá na všechny části otázky. Pozorně si přečtěte tvrzení a řádek s pokynem a všimněte si, o čem vás otázka žádá diskutovat.
Esej, která se drží tématu, ale nikdy neodpoví na položenou otázku, nemůže dosáhnout vysokého skóre (band).
Prohlédněte si otázku a pak klikněte na Další, abyste mohli pokračovat.
Prohlédněte si otázku
Napišme úvod ve dvou větách, celkem asi 25 až 35 slov. Nejprve přepište otázku vlastními slovy. Parafrázujte otázku pomocí vlastních slov a synonym. Tak zajistíte, že se esej bude držet tématu, a zároveň můžete ukázat širokou slovní zásobu. Druhá věta představí konkrétní témata, kterými se budete zabývat v hlavních odstavcích.
Napište úvod.
Napište úvod
Každý hlavní odstavec potřebuje tematickou větu, která představí jeho hlavní bod. Pro esej této délky stačí dva hlavní odstavce.
Pro každý odstavec napište jednu jasnou větu. Každá věta by měla mít 12 až 20 slov; vysvětlení a příklady si nechte na další kroky.
Napište jednu tematickou větu pro každý hlavní odstavec.
Napište dvě tematické věty
animals are killed for traditional medicine
more funding, stricter laws and education
Tematická věta získá body, jen když je podložená. Rozviňte první hlavní odstavec pomocí dvou bodů. U každého bodu napište vysvětlení a konkrétní příklad.
Každý hlavní odstavec by měl mít asi 4–5 vět, tedy 60 až 80 slov. Konkrétní situace je silnější než obecné tvrzení.
Dopište zbytek prvního hlavního odstavce.
Rozviňte hlavní odstavec 1
60
Dejte druhému hlavnímu odstavci stejnou hloubku jako prvnímu. Použijte dva body a každý podložte vysvětlením a příkladem.
Každý hlavní odstavec by měl mít asi 4–5 vět, tedy 60 až 80 slov. Neopakujte první odstavec jinými slovy.
Dopište zbytek druhého hlavního odstavce.
Rozviňte hlavní odstavec 2
60
Závěr esej uzavírá. Napište shrnutí hlavních bodů ve dvou větách a pak přidejte jednu nebo dvě věty o tom, proč je téma důležité.
Neopisujte úvod a nepřidávejte nový argument. Celý závěr by měl mít 35 až 50 slov.
Napište závěr o 3–4 větách.
Napište závěr
35
Váš úvod, tematické věty, hlavní odstavce a závěr se nyní zobrazují společně jako jedna esej. Přečtěte si ji jako jeden celek a zkontrolujte, že odpovídá na všechny části otázky.
Porovnejte své formulace s ukázkovou esejí a všimněte si, že každý odstavec plní jinou úlohu.
Projděte si esej a pak klikněte na Další, abyste mohli pokračovat.
Zkontrolujte celou esej
Jak se rozhodnout
Esej v Task 2 odpovídá na všechny části otázky. Splnění úkolu závisí na tom, zda pokryjete, na co se otázka ptá, a každý hlavní bod podpoříte vysvětlením a příkladem.
Postupujte v pevném pořadí: úvod, dvě tematické věty, dva rozvinuté hlavní odstavce a pak závěr.
- Napište úvod.
Obecně budete pro tento odstavec potřebovat dvě věty. Parafrázujte otázku vlastními slovy a pomocí synonym. Díky tomu se vaše esej drží tématu a můžete ukázat širokou slovní zásobu. Druhá věta představí konkrétní témata, kterými se budete zabývat v hlavních odstavcích. Váš úvod by proto měl obsahovat:
- Přeformulovanou otázku
- Představení konkrétních témat
- Napište dvě tematické věty. Pro každý hlavní odstavec napište jednu tematickou větu.
- Rozviňte hlavní odstavce. Každý hlavní odstavec podpořte dvěma body a ke každému bodu dejte vysvětlení a příklad. Každý hlavní odstavec by měl mít zhruba 4–5 vět.
- Napište závěr. Shrňte hlavní body a pak řekněte, proč je téma důležité.
- Zkontrolujte celou esej. Přečtěte si části společně a zkontrolujte, že jste odpověděli na všechny části otázky.
Dva rozvinuté odstavce získají víc bodů než čtyři nerozvinuté body. Examinátoři odměňují podporu, proto raději přidejte vysvětlení a příklad k bodu, který už máte, než abyste přidávali další bod.
Úvod
Obecně budete pro tento odstavec potřebovat dvě věty. Parafrázujte otázku vlastními slovy a pomocí synonym. Díky tomu se vaše esej drží tématu a můžete ukázat širokou slovní zásobu. Druhá věta představí konkrétní témata, kterými se budete zabývat v hlavních odstavcích. Váš úvod by proto měl obsahovat:
- Přeformulovanou otázku
- Představení konkrétních témat
Tematické věty
Pro každý hlavní odstavec napište jednu tematickou větu. Každá věta by měla představit hlavní bod svého odstavce ve 12 až 20 slovech a příklady si nechat na další fázi.
Podpora
Tematická věta získává body, až když je podpořená. Vysvětlete, proč bod platí, uveďte konkrétní příklad a oběma hlavním odstavcům dejte stejně silnou podporu. Každý hlavní odstavec by měl mít zhruba 4–5 vět.
Závěr
Závěr shrne hlavní body ve dvou větách a pak přidá jednu nebo dvě věty o tom, proč je téma důležité. Neopisujte úvod a nepřidávejte nový argument.
Dvoudílná otázka
V tomto typu otázky dostanete dvě otázky a budete muset odpovědět na obě otázky. Tyto dvě otázky budou různé. Například budete možná muset hodnotit důležitost myšlenky nebo akce (např. jak je to důležité?) a říct, zda souhlasíte nebo nesouhlasíte (např. souhlasíte nebo nesouhlasíte?).
News editors decide what to broadcast on television and what to print in newspapers. What factors do you think influence these decisions? Do you think that there is too much emphasis on bad news these days?
- Write at least 250 words.
- You should spend around 40 minutes on this task.
In the news business, editors have the final say in what makes it to air, or what makes it to print in newspapers. There are a variety of factors that affect their decision making; however, in my opinion, the public is inundated with negative news content, and more positive news would be beneficial to all.
Regarding news stories worth focusing on, editors must weigh up a number of aspects. For one thing, timing is a major factor in choosing stories to inform the public, especially ones that affect many people. Stories that happen right away are classified as newsworthy, however, if the same story happens again, it’s no longer interesting. For another, proximity to a story is important. Stories that happen closer to home become more newsworthy than those far away, so domestic news stories become more noteworthy than international ones. Finally, human interest stories always garner attention since they don’t date quickly, and often offer an emotion connection with the audience.
However, to my mind most news shared with the public is of a negative slant. Through TV, print and online media, society is inundated with stories of crime, disasters, and war to the point that the good news becomes exceptional. As a result, people have become accustomed to this trend and become more anxious about the state of the world. For this reason, I believe having a greater proportion of positive news in the media would benefit everyone. Stories of human interest, scientific discovery or human achievement help everyone understand the world around them, and make better decisions. That way, society can better understand the world rather than simply view it as a dangerous place.
In conclusion, although news editors face a lot of challenges in choosing newsworthy stories, I believe a more optimistic approach would add further value to the news profession.
Task Achievement — Task 2
Learn how to answer this question in a step-by-step interactive exercise
Task Achievement — Task 2
V IELTS Writing Task 2 píšete esej, která odpovídá na všechny části otázky. Pozorně si přečtěte tvrzení a řádek s pokynem a všimněte si, o čem vás otázka žádá diskutovat.
Esej, která se drží tématu, ale nikdy neodpoví na položenou otázku, nemůže dosáhnout vysokého skóre (band).
Prohlédněte si otázku a pak klikněte na Další, abyste mohli pokračovat.
Prohlédněte si otázku
Napišme úvod ve dvou větách, celkem asi 25 až 35 slov. Nejprve přepište otázku vlastními slovy. Parafrázujte otázku pomocí vlastních slov a synonym. Tak zajistíte, že se esej bude držet tématu, a zároveň můžete ukázat širokou slovní zásobu. Druhá věta představí konkrétní témata, kterými se budete zabývat v hlavních odstavcích.
Napište úvod.
Napište úvod
Každý hlavní odstavec potřebuje tematickou větu, která představí jeho hlavní bod. Pro esej této délky stačí dva hlavní odstavce.
Pro každý odstavec napište jednu jasnou větu. Každá věta by měla mít 12 až 20 slov; vysvětlení a příklady si nechte na další kroky.
Napište jednu tematickou větu pro každý hlavní odstavec.
Napište dvě tematické věty
timing, distance and human interest
too much bad news makes people anxious
Tematická věta získá body, jen když je podložená. Rozviňte první hlavní odstavec pomocí dvou bodů. U každého bodu napište vysvětlení a konkrétní příklad.
Každý hlavní odstavec by měl mít asi 4–5 vět, tedy 60 až 80 slov. Konkrétní situace je silnější než obecné tvrzení.
Dopište zbytek prvního hlavního odstavce.
Rozviňte hlavní odstavec 1
60
Dejte druhému hlavnímu odstavci stejnou hloubku jako prvnímu. Použijte dva body a každý podložte vysvětlením a příkladem.
Každý hlavní odstavec by měl mít asi 4–5 vět, tedy 60 až 80 slov. Neopakujte první odstavec jinými slovy.
Dopište zbytek druhého hlavního odstavce.
Rozviňte hlavní odstavec 2
60
Závěr esej uzavírá. Napište shrnutí hlavních bodů ve dvou větách a pak přidejte jednu nebo dvě věty o tom, proč je téma důležité.
Neopisujte úvod a nepřidávejte nový argument. Celý závěr by měl mít 35 až 50 slov.
Napište závěr o 3–4 větách.
Napište závěr
35
Váš úvod, tematické věty, hlavní odstavce a závěr se nyní zobrazují společně jako jedna esej. Přečtěte si ji jako jeden celek a zkontrolujte, že odpovídá na všechny části otázky.
Porovnejte své formulace s ukázkovou esejí a všimněte si, že každý odstavec plní jinou úlohu.
Projděte si esej a pak klikněte na Další, abyste mohli pokračovat.
Zkontrolujte celou esej
Jak se rozhodnout
Esej v Task 2 odpovídá na všechny části otázky. Splnění úkolu závisí na tom, zda pokryjete, na co se otázka ptá, a každý hlavní bod podpoříte vysvětlením a příkladem.
Postupujte v pevném pořadí: úvod, dvě tematické věty, dva rozvinuté hlavní odstavce a pak závěr.
- Napište úvod.
Obecně budete pro tento odstavec potřebovat dvě věty. Parafrázujte otázku vlastními slovy a pomocí synonym. Díky tomu se vaše esej drží tématu a můžete ukázat širokou slovní zásobu. Druhá věta představí konkrétní témata, kterými se budete zabývat v hlavních odstavcích. Váš úvod by proto měl obsahovat:
- Přeformulovanou otázku
- Představení konkrétních témat
- Napište dvě tematické věty. Pro každý hlavní odstavec napište jednu tematickou větu.
- Rozviňte hlavní odstavce. Každý hlavní odstavec podpořte dvěma body a ke každému bodu dejte vysvětlení a příklad. Každý hlavní odstavec by měl mít zhruba 4–5 vět.
- Napište závěr. Shrňte hlavní body a pak řekněte, proč je téma důležité.
- Zkontrolujte celou esej. Přečtěte si části společně a zkontrolujte, že jste odpověděli na všechny části otázky.
Dva rozvinuté odstavce získají víc bodů než čtyři nerozvinuté body. Examinátoři odměňují podporu, proto raději přidejte vysvětlení a příklad k bodu, který už máte, než abyste přidávali další bod.
Úvod
Obecně budete pro tento odstavec potřebovat dvě věty. Parafrázujte otázku vlastními slovy a pomocí synonym. Díky tomu se vaše esej drží tématu a můžete ukázat širokou slovní zásobu. Druhá věta představí konkrétní témata, kterými se budete zabývat v hlavních odstavcích. Váš úvod by proto měl obsahovat:
- Přeformulovanou otázku
- Představení konkrétních témat
Tematické věty
Pro každý hlavní odstavec napište jednu tematickou větu. Každá věta by měla představit hlavní bod svého odstavce ve 12 až 20 slovech a příklady si nechat na další fázi.
Podpora
Tematická věta získává body, až když je podpořená. Vysvětlete, proč bod platí, uveďte konkrétní příklad a oběma hlavním odstavcům dejte stejně silnou podporu. Každý hlavní odstavec by měl mít zhruba 4–5 vět.
Závěr
Závěr shrne hlavní body ve dvou větách a pak přidá jednu nebo dvě věty o tom, proč je téma důležité. Neopisujte úvod a nepřidávejte nový argument.
Názor
V tomto typu otázky dostanete otázku obsahující názor. Vaším úkolem je napsat esej v reakci na názor. Tento typ otázky se často ptá, zda souhlasíte nebo nesouhlasíte s názorem.
Some people are concerned that children spend too much time on computers – playing games, chatting and watching videos. But all this time is actually good preparation for children, who will have to spend many hours working on computers throughout their education and their working lives.To what extent do you agree or disagree with this statement?
- Write at least 250 words.
- You should spend around 40 minutes on this task.
With all the time that children spend engaged in various activities on computers, some people believe this is good preparation for a future in which many will work on computers full time through school and at work. I completely oppose this belief for several reasons.
To begin with, time on computers learning computer skills cannot be equated with that spent playing games or chatting online. While there may be some truth that videos games increase problem solving and analytical skills, there is no evidence to suggest that they improve other workplace skills. The skills children really need in a future work place are coding, designing, and software skills to name a few. The only way to ensure they learn these is for adults to be on hand to teach and supervise such learning.
Furthermore, spending too much time online may further have negative consequences to a child’s mental health. Unsupervised time on computers can result in children encountering inappropriate content online. Children have an extremely short attention span so are easily distracted by what they see or encounter online. There’s also the very real risk that children become addicted to the video games they play. Video game addiction is a proven disorder and affects many children in the US today. The quick-reward based system of such games is attractive and negatively affects how children learn and are motivated.
In conclusion, unless a child wishes to be a video game designer, increased computer time not only has little value to them beyond entertainment, it may even negatively affect a child’s development in the long term. Children should be supervised by adults when using computers to ensure they learn what they’re supposed to.
Task Achievement — Task 2
Learn how to answer this question in a step-by-step interactive exercise
Task Achievement — Task 2
V IELTS Writing Task 2 píšete esej, která odpovídá na všechny části otázky. Pozorně si přečtěte tvrzení a řádek s pokynem a všimněte si, o čem vás otázka žádá diskutovat.
Esej, která se drží tématu, ale nikdy neodpoví na položenou otázku, nemůže dosáhnout vysokého skóre (band).
Prohlédněte si otázku a pak klikněte na Další, abyste mohli pokračovat.
Prohlédněte si otázku
Napišme úvod ve dvou větách, celkem asi 25 až 35 slov. Nejprve přepište otázku vlastními slovy. Parafrázujte otázku pomocí vlastních slov a synonym. Tak zajistíte, že se esej bude držet tématu, a zároveň můžete ukázat širokou slovní zásobu. Druhá věta představí konkrétní témata, kterými se budete zabývat v hlavních odstavcích.
Napište úvod.
Napište úvod
Každý hlavní odstavec potřebuje tematickou větu, která představí jeho hlavní bod. Pro esej této délky stačí dva hlavní odstavce.
Pro každý odstavec napište jednu jasnou větu. Každá věta by měla mít 12 až 20 slov; vysvětlení a příklady si nechte na další kroky.
Napište jednu tematickou větu pro každý hlavní odstavec.
Napište dvě tematické věty
games do not teach work skills
too much screen time harms children
Tematická věta získá body, jen když je podložená. Rozviňte první hlavní odstavec pomocí dvou bodů. U každého bodu napište vysvětlení a konkrétní příklad.
Každý hlavní odstavec by měl mít asi 4–5 vět, tedy 60 až 80 slov. Konkrétní situace je silnější než obecné tvrzení.
Dopište zbytek prvního hlavního odstavce.
Rozviňte hlavní odstavec 1
60
Dejte druhému hlavnímu odstavci stejnou hloubku jako prvnímu. Použijte dva body a každý podložte vysvětlením a příkladem.
Každý hlavní odstavec by měl mít asi 4–5 vět, tedy 60 až 80 slov. Neopakujte první odstavec jinými slovy.
Dopište zbytek druhého hlavního odstavce.
Rozviňte hlavní odstavec 2
60
Závěr esej uzavírá. Napište shrnutí hlavních bodů ve dvou větách a pak přidejte jednu nebo dvě věty o tom, proč je téma důležité.
Neopisujte úvod a nepřidávejte nový argument. Celý závěr by měl mít 35 až 50 slov.
Napište závěr o 3–4 větách.
Napište závěr
35
Váš úvod, tematické věty, hlavní odstavce a závěr se nyní zobrazují společně jako jedna esej. Přečtěte si ji jako jeden celek a zkontrolujte, že odpovídá na všechny části otázky.
Porovnejte své formulace s ukázkovou esejí a všimněte si, že každý odstavec plní jinou úlohu.
Projděte si esej a pak klikněte na Další, abyste mohli pokračovat.
Zkontrolujte celou esej
Jak se rozhodnout
Esej v Task 2 odpovídá na všechny části otázky. Splnění úkolu závisí na tom, zda pokryjete, na co se otázka ptá, a každý hlavní bod podpoříte vysvětlením a příkladem.
Postupujte v pevném pořadí: úvod, dvě tematické věty, dva rozvinuté hlavní odstavce a pak závěr.
- Napište úvod.
Obecně budete pro tento odstavec potřebovat dvě věty. Parafrázujte otázku vlastními slovy a pomocí synonym. Díky tomu se vaše esej drží tématu a můžete ukázat širokou slovní zásobu. Druhá věta představí konkrétní témata, kterými se budete zabývat v hlavních odstavcích. Váš úvod by proto měl obsahovat:
- Přeformulovanou otázku
- Představení konkrétních témat
- Napište dvě tematické věty. Pro každý hlavní odstavec napište jednu tematickou větu.
- Rozviňte hlavní odstavce. Každý hlavní odstavec podpořte dvěma body a ke každému bodu dejte vysvětlení a příklad. Každý hlavní odstavec by měl mít zhruba 4–5 vět.
- Napište závěr. Shrňte hlavní body a pak řekněte, proč je téma důležité.
- Zkontrolujte celou esej. Přečtěte si části společně a zkontrolujte, že jste odpověděli na všechny části otázky.
Dva rozvinuté odstavce získají víc bodů než čtyři nerozvinuté body. Examinátoři odměňují podporu, proto raději přidejte vysvětlení a příklad k bodu, který už máte, než abyste přidávali další bod.
Úvod
Obecně budete pro tento odstavec potřebovat dvě věty. Parafrázujte otázku vlastními slovy a pomocí synonym. Díky tomu se vaše esej drží tématu a můžete ukázat širokou slovní zásobu. Druhá věta představí konkrétní témata, kterými se budete zabývat v hlavních odstavcích. Váš úvod by proto měl obsahovat:
- Přeformulovanou otázku
- Představení konkrétních témat
Tematické věty
Pro každý hlavní odstavec napište jednu tematickou větu. Každá věta by měla představit hlavní bod svého odstavce ve 12 až 20 slovech a příklady si nechat na další fázi.
Podpora
Tematická věta získává body, až když je podpořená. Vysvětlete, proč bod platí, uveďte konkrétní příklad a oběma hlavním odstavcům dejte stejně silnou podporu. Každý hlavní odstavec by měl mít zhruba 4–5 vět.
Závěr
Závěr shrne hlavní body ve dvou větách a pak přidá jednu nebo dvě věty o tom, proč je téma důležité. Neopisujte úvod a nepřidávejte nový argument.
Vzorky IELTS Writing a strategie pro IELTS Writing Task 2
Celkově existují 4 kroky k přístupu k IELTS Writing Task 2:
1. Číst a porozumět - Ačkoli se tento krok může zdát samozřejmý, mnoho zkoušejících se nechá zaplavit nervy a otázce plně neporozumí. To je důvod, proč první věc, kterou budete muset udělat během Writing Task 2, je plně porozumět otázce a podtrhnout klíčová slova. Navíc přemýšlejte o těchto dvou věcech:
- Jaký typ eseje budu muset napsat? (Například to může být Problem and Solution).
- Jak moc znám toto téma? (Tato otázka je důležitá, protože může ovlivnit strukturu, kterou si vyberete.
2. Naplánujte si svou strukturu - Nyní, když jste pochopili, co se otázka ptá, jakož i jaký typ eseje budete muset napsat, jste připraveni načrtnout svou strukturu. Tento krok nepřeskakujte. Mělo by to trvat pouze 2 nebo 3 minuty a poslouží vám jako reference dále. Také, v závislosti na tom, jak je otázka kladena, struktura se bude lišit. Chcete-li se naučit analyzovat otázku a plánovat strukturu pro každý typ eseje, podívejte se na naše lekce IELTS writing task 2
3. Udělejte si poznámky ke struktuře - Nyní, když jste vybrali a načrtli svou strukturu, udělejte si poznámky ve své struktuře pomocí klíčových slov tematických vět každého odstavce. To vám pomůže "načrtnout" svou esej a poskytne vám přehled o tom, jak bude vypadat. V tomto bodě byste již měli být schopni rozumět hlavním tématům každého odstavce.4. Začněte psát - Po naplánování své struktury začněte psát úvodem a pokračujte odtud. Ujistěte se, že používáte formální tón (nepoužívejte stažené tvary, vypisujte čísla menší než 10 atd.) a odsazujete za každým odstavcem.
Následující blogové příspěvky vás naučí, jak zvládat každý typ otázky, a obsahují více než 100 otázek IELTS writing task 2 a vzorových esejů. Neváhejte je použít pro svou přípravu na IELTS.
- How to Answer Opinion Question Types in IELTS Writing Task 2
- How to Answer Discussion Question Types in IELTS Writing Task 2
- How to Answer Advantage & Disadvantage Question Types in IELTS Writing Task 2
- How to Answer Problem and Solution Question Types in IELTS Writing Task 2
- How to Answer Answer Cause and Effect Question Types in IELTS Writing Task 2
- How to Answer Two-part Question Types in IELTS Writing Task 2