
In deze gids leer je hoe je hoogscorende essays schrijft voor IELTS writing task 1 en IELTS writing task 2. Welke toets je ook aflegt, academic of general training: wij hebben alles voor je geregeld. Deze gids bevat IELTS-schrijfvoorbeelden, onderwerpen en gedetailleerde lessen voor general writing task 1 & 2 en academic writing task 1 & 2.
Ontvang gratis IELTS Writing-voorbeeldantwoorden nadat je een IELTS Writing-oefentoets hebt voltooid.
| IELTS General Writing Test | IELTS Academic Writing Test |
|---|---|
Hieronder staat onze volledige lijst met IELTS Writing-vragen en voorbeeldessays. Opmerking: de rode links zijn onze populairste en meest aanbevolen Writing-vragen volgens onze leerlingen, en je kunt ze gratis oefenen wanneer je maar wilt.
Voorbeelden van IELTS General Writing Task 1 1 - 44
Informal, formal, & semi-formal letters
Voorbeelden van IELTS Academic Writing Task 1 1 - 52
Line graphs, bar charts, pie charts, tables, maps, flow charts, & multiple charts
Voorbeelden van IELTS Writing Task 2 1 - 96
Opinion, discussion, advantages & disadvantages, problem & solution, cause & effect, & two-part questions
Inhoudsopgave
Informatie over de IELTS Writing-toets
De Writing-toets bestaat uit 2 schrijftaken en je hebt in totaal 60 minuten om beide te voltooien. Je kunt de taken in elke gewenste volgorde doen, maar zorg dat je je tijd goed indeelt en ongeveer 20 minuten besteedt aan IELTS Writing Taak 1 en 40 minuten aan IELTS Writing Taak 2.
IELTS Academic Writing-taak vs. IELTS General Writing-taak
Het IELTS biedt twee toetsversies aan. De Academic-versie is voor mensen die hoger onderwijs willen volgen, terwijl de General Training-versie bedoeld is voor mensen die simpelweg willen migreren of een lager opleidingsniveau nastreven. Er zijn meer criteria voor beide versies, dus neem contact op met de IELTS-klantenservice om te leren welke toets geschikt voor je is.
Welke toets is dan moeilijker? De Academic-toets is, zoals je misschien al raadde, moeilijker dan de General Training-toets. Het verschil tussen de twee zit in de moeilijkheid van IELTS Writing Taak 1. Gelukkig is alleen Writing Taak 1 anders. IELTS Writing Taak 2 is voor beide toetsversies hetzelfde. De onderstaande tabel vat de twee soorten IELTS Writing-toetsen samen.
| Type toets | Taak 1 | Taak 2 |
|---|---|---|
| Academic Writing | IELTS Academic Writing Taak 1
Bij IELTS Academic Writing Taak 1 krijg je een grafiek, tabel, diagram of schema te zien en wordt je gevraagd om de informatie in je eigen woorden te beschrijven, samen te vatten of uit te leggen. |
IELTS Writing Taak 2 Bij IELTS Writing Taak 2 moet je een traditioneel essay schrijven als reactie op een vraag. Je moet minimaal 250 woorden schrijven |
| General Writing |
IELTS General Writing Taak 1
Bij IELTS General Writing Taak 1 wordt je gevraagd om een brief te schrijven over een gegeven situatie. Deze brief is van een van de volgende soorten: - Formeel (formele brieven worden gestuurd naar mensen die we niet kennen of nooit hebben ontmoet.) - Halfformeel (halfformele brieven worden gestuurd naar mensen die we niet goed kennen.) - Informeel (informele brieven worden gestuurd naar mensen die we goed kennen, zoals onze vrienden) |
Overzichtsvideo IELTS Academic Writing-taak
Overzichtsvideo IELTS General Writing-taak
Binnenkort beschikbaar!
Hoe de IELTS Writing-toets wordt beoordeeld
In de IELTS Writing-toets wordt je schrijfscore beoordeeld op basis van vier categorieën. Deze staan bekend als
Task Achievement/Task Response, Coherence and Cohesion, Lexical Resource en Grammatical Range and Accuracy.
Raadpleeg de volgende band descriptors die IELTS-examinatoren gebruiken om de Writing-sectie van de toets te beoordelen:
- IELTS Writing Taak 1 Band Descriptors
- IELTS Writing Taak 2 Band Descriptors
Let op: de beoordelingscriteria voor beide taken omvatten:
- Task Achievement/Task Response - Heb je de vraag volledig beantwoord en een volledig uitgewerkt antwoord gegeven?
- Coherence and Cohesion - Is je argument of analyse logisch? Is het goed doordacht en op een complete manier gepresenteerd?
- Lexical Resource – Heb je een breed scala aan woordenschat in een natuurlijke, formele toon gebruikt?
- Grammatical Range and Accuracy – Is je essay vrijwel foutloos? Ben je erin geslaagd om een breed scala aan grammaticale structuren te gebruiken?
Zijn IELTS Writing Taak 1 en IELTS Writing Taak 2 evenveel punten waard?
Net zoals je twee keer zoveel tijd besteedt aan het schrijven van IELTS Writing Taak 2,
is het ook ongeveer twee keer zoveel punten waard. Het is niet exact het dubbele.
Een andere manier om het te zien is om de score voor Writing Taak 2 dubbel op te tellen. Neem dus
bandscores 7 voor taak één en 4 voor taak twee, en je krijgt de volgende
formule om je IELTS Writing-score te berekenen:
(7 + (4 x 2))/3 = 5.
Daarom is de totale IELTS Writing-bandscore ongeveer 4,5 - 6. Je ziet dat we geen exact getal kunnen geven,
omdat IELTS zijn scoringsformule niet openbaar heeft gemaakt, maar de hier
gepresenteerde formule is redelijk nauwkeurig met een verschil van ongeveer 0,5 punten.
Wat 19.000 beoordeelde IELTS-essays laten zien
Tussen 2020 en 2026 beoordeelden BestMyTest-docenten ongeveer 9.400 IELTS-schrijfopdrachten en corrigeerde onze AI-beoordeling nog eens 9.614 essays. Drie dingen vallen op.
- Grammatica bepaalt de bandscore. Grammaticale variatie en nauwkeurigheid was het laagst scorende van de vier criteria bij 91% van de Task 2-essays, 84% van de Academic Task 1-verslagen en 94% van de General Training-brieven. Gemiddelde scores van docenten voor Task 2: grammatica 5.5, woordenschat 6.0, samenhang en cohesie 6.1, beantwoording van de opdracht 6.1. Voor Academic Task 1: grammatica 5.5, samenhang 5.8, taakuitvoering 5.8, woordenschat 5.8. Voor General Training Task 1: grammatica 5.3, woordenschat 5.9, samenhang 6.0, taakuitvoering 6.2.
- Korte essays worden afgestraft. 17% van de Task 2-essays bleef onder het minimum van 250 woorden en kreeg gemiddeld 4.9 voor beantwoording van de opdracht, tegenover 6.1 voor essays die 250 woorden haalden. 13% van de Academic Task 1-verslagen en 16% van de General Training-brieven telde minder dan 150 woorden. Onze cursisten schrijven gemiddeld 285 woorden voor Task 2 en ongeveer 175 woorden voor Task 1.
- De fouten zijn klein en komen steeds terug. Een Task 2-essay krijgt ongeveer 21 correcties. Interpunctie staat bovenaan (17% van de correcties), gevolgd door lidwoorden (11%), spelling (10%), enkelvoud en meervoud van zelfstandige naamwoorden (9%), congruentie tussen onderwerp en werkwoord (7%) en voorzetsels (6%). Twee derde van de Task 2-essays bevatte een lidwoordfout en 58% een congruentiefout tussen onderwerp en werkwoord. Bij Academic Task 1 leidt de woordenschat voor het beschrijven van gegevens tot extra fouten: "male" naar "males", "increase" naar "increased", "compare" naar "compared". Bij General Training-brieven spelen hoofdlettergebruik (9% van de correcties) en werkwoordstijden (6%) een grotere rol dan bij de andere opdrachten.
- De correcties die onze beoordeling het vaakst aanbrengt: "this" naar "these", "is" naar "are", "have" naar "has", "in" naar "on", "of" naar "for", "amount" naar "number", "then" naar "than", "that" naar "who", "goverment" naar "government", "belive" naar "believe", "accomodation" naar "accommodation".
De cijfers zijn afkomstig uit gegevens van BestMyTest-oefentoetsen en -beoordelingen tot en met oktober 2026. Percentages per vraagtype geven het aandeel juiste antwoorden over alle pogingen weer; cijfers per criterium zijn scores van docenten of AI, zoals aangegeven. Laatst bijgewerkt op 5 oktober 2026.
IELTS Academic Writing Taak 1
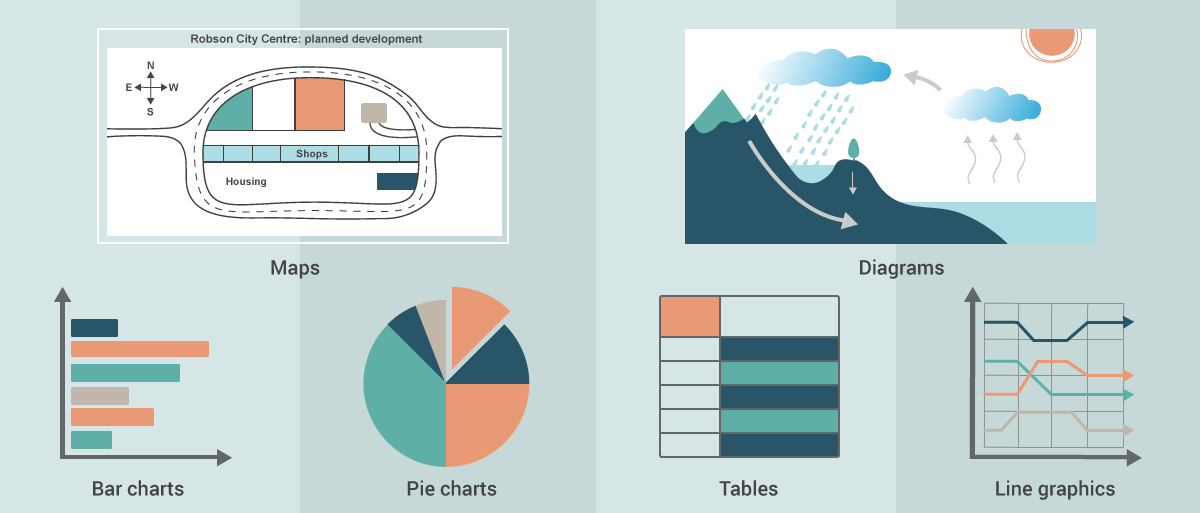
Bij IELTS Academic Writing Taak 1 krijg je een grafiek, tabel, diagram of schema te zien en wordt je gevraagd om de informatie in je eigen woorden te beschrijven, samen te vatten of uit te leggen. Je kunt worden gevraagd om gegevens te beschrijven en uit te leggen, de fasen van een proces te beschrijven, hoe iets werkt, of een object of gebeurtenis te beschrijven.
Welke visuele informatie je ook krijgt, je taak is om een samenvatting van de visuele informatie te schrijven en de belangrijkste trends, algemene verschillen, belangrijkste veranderingen of de hoofdcomponenten van een systeem of de belangrijkste fasen van een proces te beschrijven. Je moet 150 woorden of meer schrijven en je zou ongeveer 20 minuten aan dit deel van de toets moeten besteden. De schrijfstructuur kan als volgt zijn:
- Inleiding: Parafraseer de vraag
- Overzicht: Beschrijf de algemene trend of schrijf een algemeen overzicht van de belangrijkste groepen
- Hoofdparagraaf 1: Schrijf op een logische manier in detail over de eerste groep
- Hoofdparagraaf 2: Schrijf op een logische manier in detail over de tweede groep
De stappen om het verslag voor deze taak te schrijven, zijn dus heel eenvoudig:
- Analyseer de grafie(k)(en) en plan hoe je de informatie groepeert
- Schrijf een essay met behulp van de aanbevolen essaystructuur
- Lees het essay zorgvuldig na
Laten we elk verschillend mogelijk type visuele grafiek, tabel, diagram en schema bekijken dat je in je IELTS Writing-toets zou kunnen tegenkomen:
Lijngrafieken
Bij dit type taak krijg je een of meer lijngrafieken. Elke lijngrafiek bevat 1-8 lijnen die laten zien hoe waarden in de loop van de tijd veranderen. De tijdsperiode kan het verleden, het heden of de toekomst zijn, of een combinatie van alle drie. Je taak is om een samenvatting te schrijven die de belangrijkste punten omvat en je beschrijving te ondersteunen door gegevens op te nemen.
The chart illustrates average CO2 emissions per person in four European countries between 1975 and 2015.
Summarise the information by selecting and reporting the main features, and make comparisons where relevant.
- Write at least 150 words.
- You should spend around 20 minutes on this task.
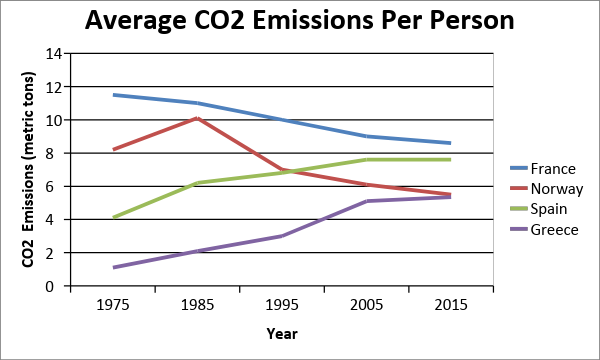
The line graph depicts the average Carbon dioxide emission for each individual residing in four countries, namely France, Norway, Spain, and Greece, over 40 years.
Overall, although CO2 production in France and Norway declined, it increased significantly in Spain and Greece over the period. Norway improved the most to become the most environmentally friendly, whereas Greece had the highest increase of all in that time.
Throughout the period, France produced the most CO2, though production declined overall from 11 tonnes per individual in 1975 to around 8.5 tonnes by 2015. In turn, except for a spike in emissions in 1985, Norway’s production of CO2 fell from 8 to under 6 tonnes forty years later.
On the contrary, CO2 release in Spain and Greece saw a more upward turn. In Spain, production doubled from 4 tonnes in 1975, overtaking Norway by 1995, to a final figure of just under 8 metric tonnes per head of population. Similarly, emissions in Greece, which were the lowest in 1975, increased five times to equal those of Norway in 2015.

Line Chart
Learn how to answer this question in a step-by-step interactive exercise
Line Chart
In IELTS Academic Task 1 beschrijf je wat een grafiek laat zien. Je geeft geen mening en je legt niet uit waarom de cijfers zijn zoals ze zijn.
Een lijndiagram laat zien hoe waarden in de tijd veranderen, vaak voor meerdere lijnen tegelijk, dus dit verslag beschrijft verandering en vergelijkt de lijnen.
Bekijk de opdracht en klik dan op Volgende om door te gaan.
Bekijk de vraag vooraf
Summarise the information by selecting and reporting the main features, and make comparisons where relevant.
Write at least 150 words.
Lees de grafiek voordat je gaat schrijven. Kijk naar de titel, de periode op de horizontale as, de eenheden op de verticale as en de legenda die elke lijn benoemt.
Zoek daarna het punt waar de gemeten gegevens ophouden en een prognose begint. Dat punt verdeelt je tijden: verleden tijd voor de jaren die al gemeten zijn, en vormen zoals is expected to, is predicted to en is set to voor de jaren die nog moeten komen.
Beantwoord de vragen over de grafiek.
Lees het diagram
De inleiding zegt in je eigen woorden wat de grafiek laat zien. Parafraseer de opdracht: verander de woorden, houd de betekenis, en behoud het onderwerp, wat de lijnen meten en de periode.
De opdrachtzin overschrijven levert niets op, en cijfers horen hier niet. Bewaar alle getallen voor de kernalinea's.
Schrijf een of twee zinnen die de opdracht parafraseren.
Schrijf de inleiding
Opdrachtvraag
The chart illustrates average CO2 emissions per person in four European countries between 1975 and 2015.
Summarise the information by selecting and reporting the main features, and make comparisons where relevant.
Write at least 150 words.
Een Task 1-verslag heeft één kernalinea per groep lijnen nodig, en een lijndiagram heeft meestal meer lijnen dan groepen. Zet de lijnen die dezelfde kant op gaan bij elkaar: de lijnen die stijgen, de lijnen die dalen en de lijnen die gelijk blijven. Gaan alle lijnen dezelfde kant op, dan heb je één alinea; is er van elke soort één, dan heb je er drie.
Eén alinea per lijn, of één alinea per helft van de periode, breekt de vergelijking waar de opdracht om vraagt. Als je alleen op niveau groepeert, kan een stijgende en een dalende lijn in dezelfde alinea terechtkomen.
Kies de indeling die elke alinea één duidelijk patroon geeft.
Maak de groepen
Kies de indeling die elke alinea één duidelijk patroon geeft.
- Group 1: Norway, Spain, Greece. Group 2: France.
- Group 1: Greece. Group 2: France, Norway, Spain.
- Group 1: Norway, Greece. Group 2: France, Spain.
- Group 1: France, Norway. Group 2: Spain, Greece.
Het overzicht is het grootste patroon in de hele grafiek. De hoofdkenmerken vormen het. Eerst: wat is de algemene richting van elke groep over de periode? Daarna: als er twee of meer groepen zijn, hoe ver liggen de eerste en de laatste groep uit elkaar, en wordt dat verschil groter, kleiner of draaien ze om?
Zet deze kenmerken bij elkaar en je hebt je overzicht. Noem hier geen losse jaren of getallen. Bewaar die voor de kernalinea's.
Zoek de hoofdkenmerken om je overzicht op te bouwen.
Bepaal de algemene trend
Maak van de twee hoofdkenmerken nu een of twee zinnen. Het overzicht is het deel van het verslag waar een examinator als eerste naar zoekt, dus schrijf het vóór de details en houd het algemeen.
Laat de tijd passen bij de grafiek, en beschrijf wat de grafiek laat zien in plaats van waarom. Noem geen cijfers en geef geen mening.
Schrijf een of twee algemene zinnen over het grootste patroon.
Schrijf je overzicht
Kernalinea 1 gaat alleen over je eerste groep lijnen, over de hele periode, en hier horen de cijfers.
Beschrijf de vorm van elke lijn in plaats van elk punt erop: de beginwaarde, de richting, elke verandering van richting en de eindwaarde of voorspelde waarde. Gebruik taal voor verandering in de tijd zoals rise steadily, fluctuate, level off en peak, en noem bij elk cijfer het jaar.
Weet je niet zeker hoe je een punt moet formuleren? Klik op dat punt, dan wordt er een voorbeeldzin aan je schrijfvak toegevoegd.
Schrijf drie of vier zinnen over je eerste groep, met cijfers.
Schrijf kernalinea 1
Kernalinea 2 gaat alleen over je tweede groep lijnen. Pak die op dezelfde manier aan: de vorm van elke lijn, onderbouwd met cijfers.
Herhaal Kernalinea 1 niet. Verbind de groepen waar een verschil het noemen waard is, met woordgroepen zoals in contrast en far lower than.
Weet je niet zeker hoe je een punt moet formuleren? Klik op dat punt, dan wordt er een voorbeeldzin aan je schrijfvak toegevoegd.
Schrijf drie of vier zinnen over je tweede groep, met cijfers.
Schrijf kernalinea 2
Je plan voor het verslag is klaar. Een volledig Task 1-antwoord heeft deze onderdelen in deze volgorde: een inleiding die de opdracht parafraseert, een overzicht van het grootste patroon, en per groep één kernalinea die dat patroon onderbouwt met gekozen cijfers.
Lees je onderdelen samen en controleer drie dingen: het overzicht en de details kloppen met elkaar, de tijd past bij gemeten en voorspelde waarden, en elk cijfer heeft zijn eenheid en zijn jaar.
Bekijk je plan voor het verslag en vergelijk het dan met het modelessay.
Volledig plan voor het verslag
Hoe je beslist
Een lijndiagram in IELTS Academic Task 1 laat zien hoe waarden in de loop van de tijd veranderen, vaak voor meerdere lijnen tegelijk. Je beschrijft die veranderingen en vergelijkt de lijnen. Je hebt niet elk punt van elke lijn nodig.
Werk in een vaste volgorde, zodat je verslag gepland is voordat je je eerste zin schrijft.
- Lees het diagram. Controleer de titel, de periode, de eenheden, de legenda en waar de gemeten gegevens ophouden en een eventuele prognose begint.
- Schrijf de inleiding. Parafraseer de opdracht en zeg wat de grafiek laat zien.
- Maak de groepen. Groepeer de lijnen die zich op dezelfde manier gedragen, zodat elke kernalinea één duidelijk idee heeft.
- Bepaal de algemene trend. Bepaal het grootste patroon in de hele grafiek voordat je naar losse waarden kijkt.
- Schrijf het verslag in fasen. Schrijf eerst het overzicht, dan één kernalinea per groep met gekozen cijfers, en bekijk daarna het hele plan.
Groepeer de lijnen voordat je ze beschrijft. Een grafiek met veel lijnen wordt een kort verslag zodra vergelijkbare lijnen één alinea delen, en groeperen is precies wat de opdracht bedoelt met het kiezen van de belangrijkste kenmerken.
Lees de grafiek
Begin bij de assen. De horizontale as geeft de periode, de verticale as geeft de eenheden en de legenda noemt elke lijn. Zoek het punt waar de gemeten gegevens ophouden, want alles daarna is een prognose en vraagt om toekomstvormen.
Inleiding
De inleiding bestaat uit een of twee zinnen die met andere woorden dan de opdracht zeggen wat de grafiek laat zien. Houd het onderwerp, wat de lijnen meten en de periode erin. Laat cijfers en trends weg.
Groepen
Een Task 1-verslag heeft één kernalinea per groep lijnen. Groepeer de lijnen die dezelfde kant op gaan: de lijnen die stijgen, de lijnen die dalen en de lijnen die gelijk blijven. Gaan alle lijnen dezelfde kant op, dan krijg je één alinea; is er van elk soort één, dan krijg je er drie.
Algemene trend
De algemene trend is het grootste patroon in de grafiek: de algemene richting van elke groep over de periode, en hoe ver de groepen uit elkaar blijven. Dit is een algemene uitspraak, dus er staan geen cijfers in.
Om te leren hoe je IELTS Academic Writing Taak 1 lijngrafieken aanpakt, bekijk onze les IELTS Academic Writing Task - Line Graphs.
7 dagen gratis proefperiodeStaafdiagrammen
Bij dit type taak krijg je een of meer staafdiagrammen. De staafdiagrammen kunnen laten zien hoe waarden in de loop van de tijd veranderen (dynamische gegevens), de verschillen tussen waarden op één moment in de tijd (statische gegevens) of de resultaten van een enquête of vragenlijst. De informatie kan gaan over de situatie in het verleden, het heden of de toekomst, of een combinatie van alle drie. Je taak is om een samenvatting te schrijven die de belangrijkste punten omvat en je beschrijving te ondersteunen door gegevens op te nemen.
The chart below shows the proportion of males and females in Malaysia who commonly do physical activity in 2010.
Summarise the information by selecting and reporting the main features, and make comparisons where necessary.
- Write at least 150 words.
- You should spend around 20 minutes on this task.
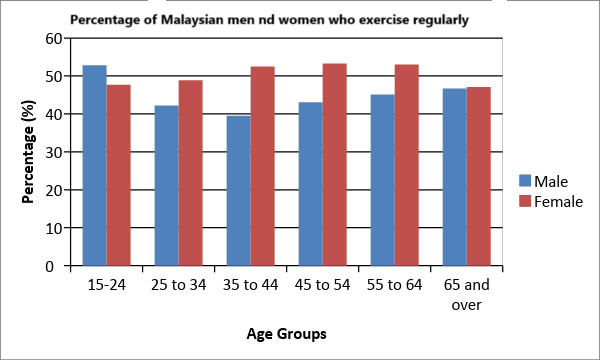
The bar chart compares the proportion of male and females of differing age groups who frequently undertook physical activity in 2010.
Overall, while the Malaysian population keeps fit in general, a higher proportion of women than men exercised in 2010, with some further differences between age groups. Middle-aged females were the most likely to work out, while for men, those aged 15 to 24 tended to do the most physical activity.
In terms of men’s exercise habits, younger men were much more likely to exercise than older men with 52.8% of those aged under 24 exercising as opposed to only around 40% of older age groups
By contrast, around half of all women in all age groups reported keeping fit, especially those aged between 35 and 64 at around 53%. The exception was the youngest age group in which only 47.7 percent of women exercised compared to 52.8% of men. Similarly, for people 65 and over, just approximately 47% of both sexes were recorded regularly working out.
Bar Chart
Learn how to answer this question in a step-by-step interactive exercise
Bar Chart
In IELTS Academic Task 1 beschrijf je wat een diagram laat zien. Je geeft geen mening en je legt niet uit waarom de cijfers zijn zoals ze zijn.
Een staafdiagram vergelijkt groepen over een reeks categorieën, dus dit verslag draait om vergelijkingen en niet om verandering in de tijd.
Bekijk de opdracht en klik dan op Volgende om door te gaan.
Bekijk de vraag vooraf
Summarise the information by selecting and reporting the main features, and make comparisons where necessary.
Write at least 150 words
Lees het diagram voordat je gaat schrijven. Kijk naar de titel, de categorieën op de horizontale as, de eenheden op de verticale as en de legenda die elke groep staven benoemt.
De eenheden bepalen je woordkeuze. Aantallen mensen, percentages en geldbedragen zijn niet hetzelfde, en een verkeerde eenheid kost punten, ook als de rest van de zin klopt.
Beantwoord de vragen over het diagram.
Lees het diagram
De inleiding zegt in je eigen woorden wat het diagram laat zien. Parafraseer de opdracht: verander de woorden, houd de betekenis, en behoud het onderwerp, de groepen die vergeleken worden, en de plaats of periode als de opdracht die noemt.
De opdrachtzin overschrijven levert niets op, en cijfers horen hier niet. Bewaar alle getallen voor de kernalinea's.
Schrijf een of twee zinnen die de opdracht parafraseren.
Schrijf de inleiding
Opdrachtvraag
The chart below shows the proportion of males and females in Malaysia who commonly do physical activity in 2010.
Summarise the information by selecting and reporting the main features, and make comparisons where necessary.
Write at least 150 words
Een Task 1-verslag heeft één kernalinea per groep nodig, dus bepaal vroeg hoe je de gegevens verdeelt. Zet de reeksen uit de legenda die zich op dezelfde manier gedragen bij elkaar: reeksen die op een vergelijkbaar niveau liggen, of die in dezelfde categorieën hoger en lager zijn, komen in één alinea. Reeksen die zich anders gedragen, krijgen een eigen alinea. Zo heeft elke alinea één duidelijk idee.
Een verdeling die alleen hoge van lage waarden scheidt, of die elke categorie een eigen alinea geeft, laat je jezelf herhalen.
Kies de indeling die elke alinea één duidelijk idee geeft.
Maak de groepen
Kies de indeling die elke alinea één duidelijk idee geeft.
- Group 1: Female. Group 2: Male.
- One group: Male and Female.
Het overzicht is het grootste patroon in het hele diagram. Het bestaat uit maximaal drie hoofdkenmerken. Welke groep is in de meeste categorieën hoger? Welke groep is in de meeste categorieën het laagst? Is het verschil in elke categorie ongeveer even groot, of wijkt één categorie sterk af van de rest?
Niet elk diagram laat ze alle drie zien, dus deze stap vraagt alleen naar de kenmerken die voor dit diagram belangrijk zijn. Zet ze bij elkaar en je hebt je overzicht. Noem hier geen losse getallen. Bewaar die voor de kernalinea's.
Zoek de hoofdkenmerken om je overzicht op te bouwen.
Bepaal de algemene trend
Maak van de hoofdkenmerken die je hebt gevonden nu een of twee zinnen. Het overzicht is het deel van het verslag waar een examinator als eerste naar zoekt, dus schrijf het vóór de details en houd het algemeen.
Beschrijf wat het diagram laat zien, niet waarom het er zo uitziet. Noem geen cijfers en geef geen mening.
Schrijf een of twee algemene zinnen over het grootste patroon.
Schrijf je overzicht
Kernalinea 1 gaat alleen over je eerste groep, en hier horen de cijfers.
Kies de vergelijkingen die ertoe doen: de hoogste waarde, de laagste waarde en elke categorie die zich anders gedraagt dan de rest. Omdat een staafdiagram groepen in dezelfde periode vergelijkt, gebruik je vergelijkende taal zoals higher than, twice as many as en the largest of all the categories.
Weet je niet zeker hoe je een punt moet formuleren? Klik op dat punt, dan wordt er een voorbeeldzin aan je schrijfvak toegevoegd.
Schrijf drie of vier zinnen over je eerste groep, met cijfers.
Schrijf kernalinea 1
Kernalinea 2 gaat alleen over je tweede groep. Pak die op dezelfde manier aan als de eerste: de duidelijkste vergelijkingen, onderbouwd met cijfers.
Herhaal Kernalinea 1 niet. Verbind de groepen waar een verschil het noemen waard is, met woordgroepen zoals in contrast en compared with.
Weet je niet zeker hoe je een punt moet formuleren? Klik op dat punt, dan wordt er een voorbeeldzin aan je schrijfvak toegevoegd.
Schrijf drie of vier zinnen over je tweede groep, met cijfers.
Schrijf kernalinea 2
Je plan voor het verslag is klaar. Een volledig Task 1-antwoord heeft deze onderdelen in deze volgorde: een inleiding die de opdracht parafraseert, een overzicht van het grootste patroon, en per groep één kernalinea die dat patroon onderbouwt met gekozen cijfers.
Lees je onderdelen samen en controleer drie dingen: het overzicht en de details kloppen met elkaar, elk cijfer heeft zijn eenheid, en je hebt het diagram beschreven zonder het te verklaren.
Bekijk je plan voor het verslag en vergelijk het dan met het modelessay.
Volledig plan voor het verslag
Hoe je beslist
Bij een staafdiagram in IELTS Academic Task 1 beschrijf je wat het diagram laat zien en vergelijk je de groepen erin. Je hebt niet elk getal nodig. Je hebt de vergelijkingen nodig die ertoe doen.
Werk in een vaste volgorde, zodat je verslag gepland is voordat je je eerste zin schrijft.
- Lees het diagram. Controleer de titel, de categorieën, de eenheden en de legenda voordat je iets schrijft.
- Schrijf de inleiding. Parafraseer de opdracht en zeg wat het diagram laat zien.
- Maak de groepen. Verdeel de gegevens zo dat elke kernalinea één duidelijk idee heeft.
- Bepaal de algemene trend. Bepaal het grootste patroon in het hele diagram voordat je naar losse waarden kijkt.
- Schrijf het verslag in fasen. Schrijf eerst het overzicht, dan één kernalinea per groep met gekozen cijfers, en bekijk daarna het hele plan.
Een duidelijk overzicht is meer waard dan extra getallen. De opdracht vraagt je de belangrijkste kenmerken te kiezen, dus een algemene uitspraak met een paar sterke vergelijkingen scoort beter dan een lijst met alle waarden.
Lees het diagram
Begin bij de assen. De horizontale as noemt wat er wordt vergeleken, de verticale as geeft de eenheden en de legenda noemt elke groep staven. Een verslag met de verkeerde eenheid verandert de betekenis van elke zin erin.
Inleiding
De inleiding bestaat uit een of twee zinnen die met andere woorden dan de opdracht zeggen wat het diagram laat zien. Houd het onderwerp, de vergeleken groepen en de plaats of tijd erin. Laat cijfers en trends weg.
Groepen
Een Task 1-verslag heeft één kernalinea per groep. Groepeer de reeksen uit de legenda die zich op dezelfde manier gedragen: reeksen op een vergelijkbaar niveau, of reeksen die in dezelfde categorieën hoger en lager zijn. Dan heeft elke alinea één idee en herhaal je jezelf nooit.
Algemene trend
De algemene trend is het grootste patroon in het diagram: welke groep in de meeste categorieën hoger is, welke groep in de meeste categorieën het laagst is, en of het verschil in elke categorie ongeveer gelijk is of dat één categorie sterk afwijkt. Een diagram kan er één, twee of alle drie laten zien. Dit is een algemene uitspraak, dus er staan geen cijfers in.
Staafdiagrammen komen vrij vaak voor in IELTS Writing Taak 1 Academic. Er zijn drie verschillende scenario's die je in een staafdiagram-taak kunt tegenkomen:
- Een staafdiagram met categorieën op de x-as
- Een staafdiagram met datums of jaren op de as (functioneert als een lijngrafiek)
- Twee staafdiagrammen gepresenteerd
Elk scenario vereist dat je het verslag anders schrijft. Meld je aan voor een gratis proefperiode van 7 dagen om toegang te krijgen tot de volgende lessen over staafdiagrammen:
- Les IELTS Academic Writing Task - Bar Charts Part 1.
- Les IELTS Academic Writing Task - Bar Charts Part 2.
- Les IELTS Academic Writing Task - Bar Charts Part 3.
Cirkeldiagrammen
Bij dit type taak krijg je een, twee of drie cirkeldiagrammen. De cirkeldiagrammen kunnen percentages van een totaalcijfer laten zien. Als je één cirkeldiagram hebt, vertegenwoordigt dit één moment in de tijd (statische gegevens). Als je twee of meer cirkeldiagrammen hebt, kunnen deze laten zien hoe de percentages in de loop van de tijd veranderen of verschillende landen of groepen vergelijken. Je taak is om een samenvatting te schrijven die de belangrijkste punten omvat en je beschrijving te ondersteunen door gegevens op te nemen.
The charts below show the percentage of water used for different purposes in six areas of the world. Summarise the information by selecting and reporting the main features, and make comparisons where relevant.
- Write at least 150 words.
- You should spend around 20 minutes on this task.
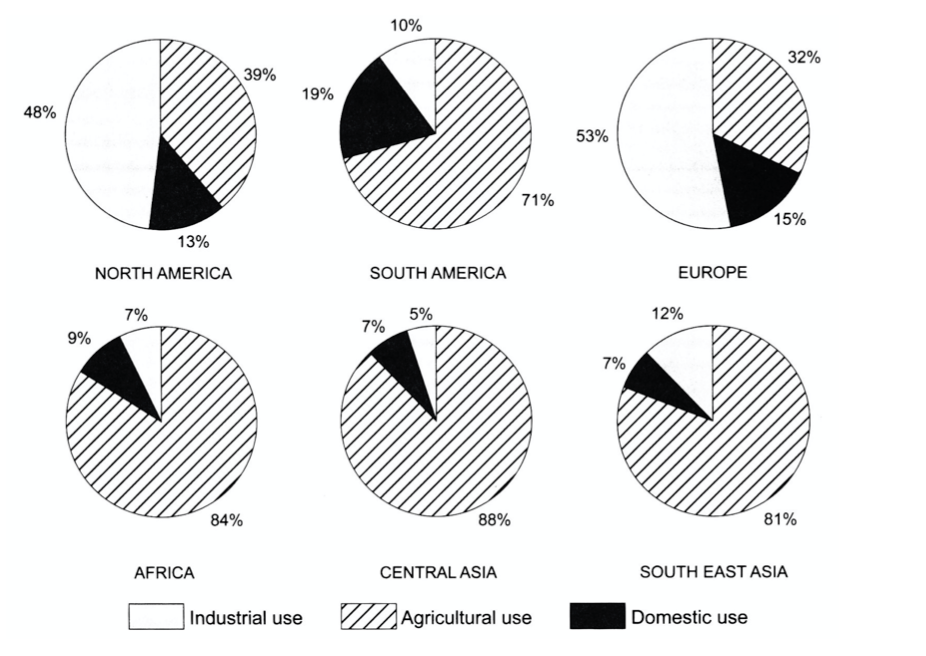
The pie charts provide information regarding the proportions of water used for industrial, agriculture, and domestic use in six regions.
In general, water serves mostly an industrial purpose in North America and Europe, whereas it is predominantly used for agriculture in South America, Africa, Central Asia, and South-East Asia.
Regarding industrial and domestic use, North America and Europe consume an average of approximately 50 percent of water for industrial purposes. However, these two regions report much less water consumption for domestic purposes, utilizing 13 percent and 15 percent, respectively. Out of all six regions, South America dedicates the highest percentage of water consumption for domestic use, but uses only 10 percent for industrial reasons. Both industrial and domestic use remain the least popular choices in Africa, Central Asia, and South-East Asia, where their combined use makes up less than 20 percent of the overall water consumption in each of the three regions.
Agricultural use, on the other hand, accounts for 71 percent of water consumption in South America and over three-fourths of water use in Africa, South-East Asia, and Central Asia, where it is nearly 90 percent. North America and Europe consume less than 40 percent of water for agricultural purposes.
Om te leren hoe je IELTS Academic Writing Taak 1 cirkeldiagrammen aanpakt, meld je aan voor een gratis proefperiode van 7 dagen om toegang te krijgen tot de les IELTS Academic Writing Task - Pie Charts.
7 dagen gratis proefperiodeTabellen
Bij dit type taak krijg je een tabel met gegevens. Deze kan dynamische cijfers tonen die in de loop van de tijd veranderen of statische gegevens voor één moment in de tijd. Vaak is er te veel informatie, dus je zult niet elk detail kunnen opnemen. Je taak is om een samenvatting te schrijven die de belangrijkste punten omvat en je beschrijving te ondersteunen door gegevens op te nemen.
The table below gives the average time spent and distance traveled by UK commuters in one year. Time and distance are given in minutes and miles accordingly.
Summarise the information by selecting and reporting the main features, and make comparisons where relevant.
Commuting Habits of different regions of the UK in a year
UK Region | Average Commuting Time (minutes) | Average Commuting Distance (miles) |
London | 54 | 14 |
South East | 78 | 20 |
Scotland | 45 | 19 |
West Midlands | 39 | 18 |
North West | 36 | 18 |
Northern Ireland | 36 | 15 |
Yorkshire & Humberside | 36 | 14 |
South West | 34 | 16 |
East Anglia | 33 | 15 |
North East | 32 | 19 |
East Midlands | 32 | 15 |
Wales | 27 | 14 |
- Write at least 150 words.
- You should spend around 20 minutes on this task.
The table shows data on the average commuting time (minutes) and distance (miles) completed by UK citizens in 12 different regions in one year.
Overall, with the exception of London, the further people travel, the more time they need to reach work people. Commuters in the south east region spend the longest time commuting over the greatest distance, whereas people in Wales spend the least.
Regarding the top three UK regions, on average, people in the south east travel both the farthest and longest at 20 miles over 78 minutes. Likewise inhabitants of Scotland journey a similar distance to work, yet spend almost half the time doing so at 45 minutes to get there, while those living in London spend the second-longest time travelling (54 minutes) over just 14 miles.
Of the other regions, people in the West Midlands spent the most time travelling at 39 minutes whereas those in Wales recorded the lowest time at 27 minutes. With regard to distance, residents of the North East, West Midlands and North West recorded the greatest mileage at 19, 18 and 18 miles respectively, while people in Yorkshire and Humberside as well as Wales both travelled the shortest distance to work of all at 14 miles.
Om te leren hoe je IELTS Academic Writing Taak 1 tabellen aanpakt, meld je aan voor een gratis proefperiode van 7 dagen om toegang te krijgen tot de volgende lessen:
- Les IELTS Academic Writing Task - Tables Part 1.
- Les IELTS Academic Writing Task - Tables Part 2.
Procesdiagrammen
Bij dit type vraag krijg je een diagram dat laat zien hoe iets werkt.
Het diagram kan een machine, een systeem of een natuurverschijnsel laten zien.
Vaak is er geen of weinig data opgenomen.
Je taak is om de informatie in het diagram samen te vatten.
The diagram below shows the water cycle, which is the continuous movement of water on, above and below the surface of the Earth.
Summarise the information by selecting and reporting the main features.
- Write at least 150 words.
- You should spend around 20 minutes on this task.
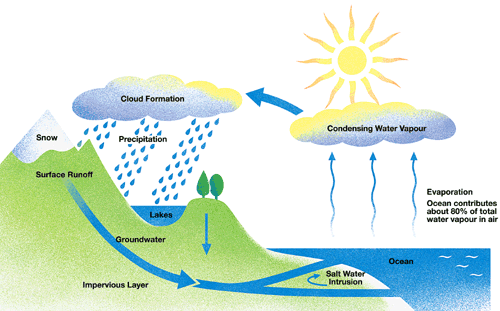
The diagram illustrates the hydrological cycle by which water moves through our natural environment. Overall, there are several stages to the process involving evaporation, precipitation and the final return of water to the ocean where the process begins over.
Since 80% of all water begins in the ocean, most water originates from this source. Initially sea water is warmed by the sun, causing it to evaporate into the air becoming water vapor. This then rises to condense into clouds at a higher elevation, which are then then pushed by the wind over land where it condenses further and precipitation occurs, falling as either snow or rain.
After precipitation on land, water then takes one of three routes. Some of it may fall into lakes or return to the ocean as surface runoff. Still further water percolates underground to an impermeable layer where it again flows back to the sea. Salt water also intrudes from the ocean into the land in coastal areas.

Process Diagram
Learn how to answer this question in a step-by-step interactive exercise
Process Diagram
Een opdracht met een processchema in IELTS Academic Task 1 laat stap voor stap zien hoe iets wordt gemaakt of hoe een systeem werkt. Je beschrijft de fasen in de volgorde van het schema, en je geeft geen redenen of meningen.
Bekijk de opdrachtvraag en klik dan op Volgende om door te gaan.
Bekijk de vraag vooraf
Summarise the information by selecting and reporting the main features.
Write at least 150 words.
Zorg dat je het schema begrijpt voordat je iets schrijft. Tel de stappen en volg de pijlen om te zien waar het proces begint en waar het eindigt. Als de laatste pijl teruggaat naar de eerste fase, is het proces een cyclus en is er geen eindproduct.
Beantwoord de vragen over het schema.
Lees het diagram
De inleiding vertelt de lezer wat het schema laat zien. Parafraseer de opdrachtvraag in je eigen woorden in plaats van haar over te schrijven, en noem het proces. Beschrijf hier nog geen van de stappen.
Schrijf een of twee zinnen voor je inleiding.
Schrijf de inleiding
Opdrachtvraag
The diagram below shows the water cycle, which is the continuous movement of water on, above and below the surface of the Earth.
Summarise the information by selecting and reporting the main features.
Write at least 150 words.
Een IELTS Task 1-verslag heeft één kernalinea per groep fasen nodig. Schrijf niet één alinea per stap. Verdeel het proces op de natuurlijke breekpunten, waar de plaats, het materiaal of het doel verandert, zodat elke groep een reeks fasen is die op elkaar volgen. De meeste processen geven twee groepen; een kort proces kan er één geven, en een lang proces drie.
Kies de groepen.
Maak de groepen
Kies de groepen.
- Group 1: stages 1 to 2 (Evaporation to Condensing Water Vapour). Group 2: stages 3 to 4 (Cloud Formation to Precipitation). Group 3: stages 5 to 6 (Surface Runoff to Groundwater).
- Group 1: stages 1 to 3 (Evaporation to Cloud Formation). Group 2: stages 4 to 5 (Precipitation to Surface Runoff). Group 3: stage 6 (Groundwater).
- Group 1: stages 1 to 3 (Evaporation to Cloud Formation). Group 2: stages 4 to 6 (Precipitation to Groundwater).
- Group 1: stages 1 to 2 (Evaporation to Condensing Water Vapour). Group 2: stages 3 to 5 (Cloud Formation to Surface Runoff). Group 3: stage 6 (Groundwater).
Het overzicht vat het hele proces in één oogopslag samen. Vraag je af hoeveel stappen er zijn en wat de belangrijkste fasen zijn van begin tot eind. Een proces wordt zelden met iets anders vergeleken, dus beschrijf de vorm van het proces in plaats van te zoeken naar een stijging of daling.
Beantwoord de vragen om de algemene trend te vinden.
Bepaal de algemene trend
Gebruik je aantekeningen uit de vorige stap. Het overzicht noemt het aantal stappen en de belangrijkste fasen, en zegt of het proces eindigt met een product of zich herhaalt als cyclus. Bewaar apparatuur, tijden en temperaturen voor de kernalinea's, en geef geen redenen of meningen.
Schrijf een of twee zinnen voor je overzicht.
Schrijf je overzicht
Kernalinea 1 beschrijft de eerste groep fasen, stap voor stap in de volgorde van de pijlen. Gebruik passieve vormen zoals is heated, is mixed en is poured, omdat het schema zelden zegt wie het werk doet. Verbind de stappen met volgordewoorden zoals first, then en after that.
Schrijf drie of vier zinnen voor Kernalinea 1.
Schrijf kernalinea 1
Kernalinea 2 beschrijft je tweede groep fasen. Die gaat verder waar Kernalinea 1 stopte, zodat de volgorde nooit wordt onderbroken. Blijf passieve vormen gebruiken, en verbind de groepen met woordgroepen zoals once en after this. Is dit de laatste alinea, markeer het einde dan met in the final stage of finally, en als het proces een cyclus is, zeg dan dat de laatste stap terugleidt naar de eerste.
Schrijf drie of vier zinnen voor Kernalinea 2.
Schrijf kernalinea 2
Je onderdelen vormen nu één verslag: de inleiding, het overzicht en één kernalinea per groep fasen. Lees ze samen en controleer of de fasen nog op volgorde staan, of de passieve vormen kloppen en of het verslag lang genoeg is.
Lees je volledige plan voor het verslag en klik dan op Volgende om het te vergelijken met het modelverslag.
Volledig plan voor het verslag
Hoe je beslist
Een opdracht met een processchema laat stap voor stap zien hoe iets wordt gemaakt of hoe een systeem werkt. Het schema heeft een vaste volgorde, dus het verslag volgt die volgorde van de eerste tot de laatste fase.
Werk in een vaste volgorde, zodat de fasen op volgorde blijven en je geen stap overslaat.
- Lees het diagram. Tel de stappen en volg de pijlen om te zien waar het proces begint en waar het eindigt.
- Schrijf de inleiding. Parafraseer de opdrachtvraag en noem het proces, zonder details.
- Maak de groepen. Knip de fasen op de natuurlijke punten van het proces in groepen, één kernalinea per groep.
- Bepaal de algemene trend. Bepaal hoeveel stappen er zijn en wat de belangrijkste fasen van begin tot eind zijn.
- Schrijf het overzicht en de kernalinea's. Vat eerst de vorm van het proces samen en beschrijf dan de stappen op volgorde.
- Volledig plan voor het verslag. Lees je onderdelen samen en vergelijk ze met het modelverslag.
Een procesverslag schrijf je in de passieve vorm. Het schema zegt zelden wie het werk doet, dus gebruik vormen zoals ‘is heated’, ‘is mixed’ en ‘is stored’, en verbind de stappen met volgordewoorden zoals ‘first’, ‘after that’ en ‘finally’.
Lezen
Een processchema toont fasen die met pijlen verbonden zijn. Tel de stappen en volg de pijlen om te controleren waar het proces begint en waar het eindigt. Gaat de laatste pijl terug naar de eerste fase, dan is het proces een kringloop en is er geen eindproduct.
Inleiding
De inleiding zegt wat het schema laat zien. Parafraseer de opdrachtvraag in je eigen woorden in plaats van haar over te nemen, en noem het proces. Houd de afzonderlijke stappen uit deze zinnen.
Groepen
Een Task 1-verslag heeft één kernalinea per groep fasen. Schrijf niet één alinea per stap. Knip het proces op de natuurlijke punten, waar de plaats, het materiaal of het doel verandert, zodat elke groep een reeks fasen is die op elkaar volgen. De meeste processen geven twee groepen; een kort proces kan er één geven, en een lang proces drie.
Trend
Het overzicht vat het hele proces in één oogopslag samen: hoeveel stappen er zijn en wat de belangrijkste fasen zijn. Een proces wordt zelden met iets anders vergeleken, dus beschrijf de vorm van het proces in plaats van te zoeken naar een stijging of een daling.
Schrijven
Het overzicht komt eerst en blijft algemeen, zonder apparatuur, tijden of temperaturen. Elke kernalinea beschrijft daarna de stappen in de volgorde die de pijlen aangeven. Gebruik passieve vormen zoals ‘is heated’ en ‘is poured’, en verbind de stappen met volgordewoorden zoals ‘first’, ‘next’, ‘after that’ en ‘finally’.
Om te leren hoe je IELTS Academic Writing Taak 1 procesdiagrammen aanpakt, meld je aan voor een gratis proefperiode van 7 dagen om toegang te krijgen tot de les IELTS Academic Writing Task - Process Diagrams.
7 dagen gratis proefperiodeKaarten
Bij dit type vraag krijg je een, twee of drie kaarten.
De kaarten kunnen een dorp, stad, eiland of ander geografisch gebied laten zien.
Kaarten tonen meestal de veranderingen die in een gebied gedurende een bepaalde periode hebben plaatsgevonden.
De veranderingen kunnen verband houden met bouw (bijv. de ontwikkeling van een gebied voor toerisme)
of met vernietiging (bijv. hoe een gebied werd getroffen door een natuurramp zoals een aardbeving)
Je taak is om een samenvatting te schrijven van de veranderingen die hebben plaatsgevonden en de belangrijkste punten te behandelen.
The maps below show the centre of a small town called Islip as it is now, and plans for its development. Summarise the information by selecting and reporting the main features, and make comparisons where relevant.
- Write at least 150 words.
- You should spend around 20 minutes on this task.
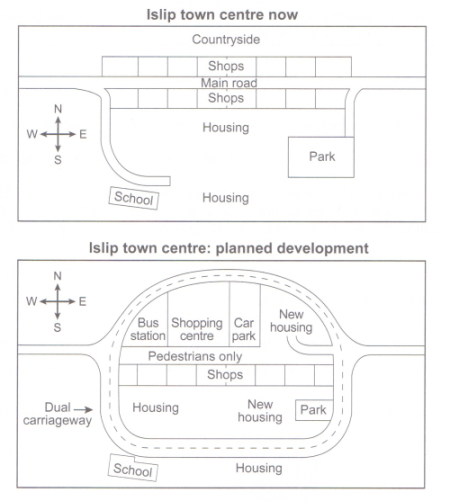
The diagrams illustrate some proposed changes to the central area of the town of Islip.
Overall, the principal change to the town will be the construction of a ring road around the centre. Various other developments with regard to shops and housing will accompany the building of this road.
As the first map reveals, lslip town center now is relatively small. There is a main road from the west to the east with shops on both sides. The northern area is rarely countryside, while the southern area is filled with houses with a school at the end of the fork road in the southwest corner and a park in the southeast area.
In the future, the main road is expected to reform into a dual carriageway as a round containing all the new buildings. The shops along the north side of the new pedestrian street will be demolished to make way for a bus station, shopping centre, car parks and new housing area. The shops along the south side of the street will remain, but it seems that the town's park will be reduced in size so that more new houses can be built within the ring road.
Map
Learn how to answer this question in a step-by-step interactive exercise
Map
Bij een kaartopdracht in IELTS Academic Task 1 krijg je twee of meer plattegronden van dezelfde plek op verschillende momenten, meestal twee. Je schrijft een verslag van minstens 150 woorden waarin je beschrijft hoe de plek is veranderd, en je geeft geen meningen of redenen.
Bekijk de opdracht en klik dan op Volgende om door te gaan.
Bekijk de vraag vooraf
Write at least 150 words.
Begin met het lezen van de kaarten, niet met schrijven. Kijk welke plek er wordt getoond, welke momenten worden vergeleken en hoeveel kaarten je hebt. Zoek daarna wat er nieuw is, wat er is verdwenen en wat nu voor iets anders wordt gebruikt.
Beantwoord de vragen over de kaarten.
Lees het diagram
De inleiding parafraseert de opdracht in je eigen woorden. Noem wat de kaarten laten zien en welke periode ze beslaan, en verander de woorden van de opdracht in plaats van ze over te schrijven. Details, taal voor de ligging en werkwoorden voor verandering komen later.
Schrijf een of twee zinnen die de opdracht parafraseren.
Schrijf de inleiding
Opdrachtvraag
The maps below show the centre of a small town called Islip as it is now, and plans for its development. Summarise the information by selecting and reporting the main features, and make comparisons where relevant.
Write at least 150 words.
Een Task 1-verslag heeft één kernalinea per groep kaarten nodig. Meestal is elke kaart een eigen groep: de eerdere kaart in de eerste alinea en de latere kaart in de tweede, omdat je zo de momenten uit elkaar houdt. Twee kaarten die je het best samen beschrijft, kunnen één groep vormen, en drie kaarten geven meestal drie alinea's.
Eén alinea per onderdeel, of één per helft van de kaart, breekt de vergelijking tussen de momenten.
Kies de indeling die duidelijke kernalinea's geeft.
Maak de groepen
Kies de indeling die duidelijke kernalinea's geeft.
- One group: now and planned development.
- Group 1: now. Group 2: planned development.
Het overzicht noemt de grootste verandering over de hele periode. Vraag je af of de plek groter of kleiner is geworden, en welke soorten grondgebruik zijn verschenen of verdwenen. Losse onderdelen en precieze liggingen horen niet in het overzicht.
Kies de antwoorden die de algemene verandering beschrijven.
Bepaal de algemene trend
Schrijf nu het overzicht in je eigen woorden, met de aantekeningen uit de vorige stap. Een of twee zinnen zijn genoeg. Beschrijf de algemene ontwikkeling van de plek, en laat precieze liggingen, losse onderdelen en elke reden voor de verandering weg.
Schrijf je overzicht in een of twee zinnen.
Schrijf je overzicht
De eerste kernalinea beschrijft de kaart of kaarten in je eerste groep in detail. Gebruik verledentijdsvormen voor een situatie die voorbij is, en gebruik taal voor de ligging zoals ‘to the north of’, ‘beside’ en ‘on the edge of’, zodat de lezer elk onderdeel kan plaatsen. Beschrijf onderdelen, geen redenen.
Schrijf drie of vier zinnen voor Kernalinea 1.
Schrijf kernalinea 1
De tweede kernalinea beschrijft de kaart of kaarten in je tweede groep en de verandering sinds de eerdere kaart. Gebruik passieve vormen voor wat er is gebouwd, weggehaald of vervangen, zoals ‘was built’, ‘had been cleared’ en ‘has been converted’, omdat de kaarten niet zeggen wie het werk heeft gedaan. Taal voor de ligging laat nog steeds zien waar elke verandering plaatsvond.
Schrijf drie of vier zinnen voor Kernalinea 2.
Schrijf kernalinea 2
Je onderdelen vormen nu één verslag: inleiding, overzicht en één kernalinea per groep kaarten. Lees ze op volgorde en controleer of het overzicht het grote geheel noemt en of de kernalinea's de details bevatten.
Lees je plan voor het verslag en vergelijk het dan met het modelverslag.
Volledig plan voor het verslag
Hoe je beslist
Een kaartopdracht geeft je twee of meer plattegronden van dezelfde plek op verschillende momenten. Je beschrijft niet elk label. Je meldt hoe de plek tussen die momenten is veranderd.
Werk in een vaste volgorde, zodat het verslag eerst het grote geheel geeft en dan pas de details.
- Lees het diagram. Controleer de plek, de momenten en de belangrijkste kenmerken op elke kaart voordat je plant.
- Maak de groepen. Verdeel de informatie in groepen kaarten, met één kernalinea per groep, meestal eerst de oudere kaart en daarna de latere.
- Bepaal de algemene trend. Bepaal de grootste verandering over de hele periode, zoals groei, achteruitgang of een nieuw gebruik van het terrein.
- Schrijf het verslag in fasen. Schrijf de inleiding, dan het overzicht en dan één kernalinea per groep.
- Volledig plan voor het verslag. Lees de onderdelen samen en vergelijk ze met het modelverslag.
Plaatsaanduidingen en passieve vormen dragen een kaartverslag. Uitdrukkingen als ‘to the north of’ en ‘beside the river’ plaatsen elk kenmerk, en vormen als ‘was built’ of ‘had been removed’ melden een verandering zonder te zeggen wie het werk deed.
Lezen
Controleer voordat je plant wat de kaarten laten zien: de plek, de momenten en de belangrijkste kenmerken op elke kaart. Kijk daarna wat er nieuw is, wat er verdwenen is en wat nu voor iets anders wordt gebruikt. Door deze leesfase voorkom je dat je maar één van de kaarten beschrijft.
Groepen
Een IELTS Task 1-verslag heeft één kernalinea per groep kaarten. Meestal is elke kaart een eigen groep, eerst de oudere kaart en daarna de latere. Twee kaarten die je het best samen kunt beschrijven, kunnen één groep vormen, en drie kaarten geven meestal drie alinea's. Bepaal de verdeling voordat je schrijft, want die legt de volgorde van het hele verslag vast.
Overzicht
Het overzicht noemt de grootste verandering over de hele periode, niet het kleine detail. Vraag je af of de plek groter of kleiner is geworden, en welke soorten grondgebruik zijn verschenen of verdwenen. Losse kenmerken en precieze posities horen in de kernalinea's.
Schrijven
Het verslag wordt in korte fasen opgebouwd. De inleiding parafraseert de opdracht, het overzicht noemt de belangrijkste verandering en elke kernalinea beschrijft één groep. Gebruik verleden tijden voor een situatie die voorbij is, passieve vormen zoals ‘was built’ of ‘had been cleared’ voor de veranderingen, en plaatsaanduidingen om te laten zien waar elk kenmerk ligt.
Om te leren hoe je IELTS Academic Writing Taak 1 kaarten aanpakt, meld je aan voor een gratis proefperiode van 7 dagen om toegang te krijgen tot de les IELTS Academic Writing Task - Maps.
7 dagen gratis proefperiodeGemengde data
Bij dit type taak krijg je twee gegevenssets.
De gegevens zijn van verschillende soorten. Bijvoorbeeld: één set kan veranderingen in de loop van de tijd tonen, terwijl de tweede set statisch is.
Of de ene gegevensset kan percentages tonen, terwijl de tweede set getallen toont.
Het kan ook zijn dat je een illustratie krijgt (bijv. een diagram of kaart) en een gegevensset (bijv. een staafdiagram, lijngrafiek, cirkeldiagram of tabel)
Je taak is om beide gegevenssets samen te vatten.
The pie graph depicts the main reasons for the productivity loss of agricultural land worldwide. The table shows how these causes influenced three world regions during the 2000s.
Summarise the information by selecting and reporting the main features, and make comparisons where relevant.
Causes of Land Degradation by Region (%) | ||||
Region: | Deforestation | Over-cultivation | Over-grazing | Total land degraded |
North America | 0.3 | 3.4 | 1.7 | 5.4 |
Asia | 9.8 | 7.8 | 5.7 | 23.3 |
Australia & Oceania | 1.6 | 0.3 | 11 | 12.9 |
- Write at least 150 words.
- You should spend around 20 minutes on this task.
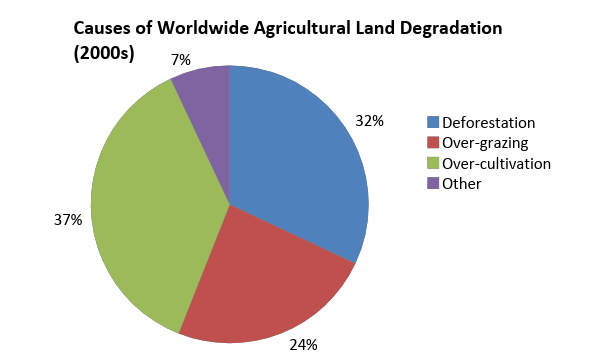
The pie chart shows the four main causes of farmland degradation in the world today, while the table presents the amount of land surface area affected by each one in three separate global regions during the 2000s.
Overall, Asia suffered more from the deterioration of farmland than other regions owing to deforestation and over-cultivation which were also the primary reasons for agricultural land loss worldwide.
Globally, 69% of degraded land is attributed to excessive cultivation and tree clearance, constituting 37% and 32% respectively. A further quarter of global land loss is due to over cultivation of crops. Other causes made up only 7% collectively.
In the 2000s, these causes affected regions of our planet differently. Asia was the worst affected where the top two causes of global land loss, deforestation and over-cultivation, resulted in 9.8% and 7.8% of degraded land there. The impact on Australia and Oceania was less severe though over-grazing was the predominant cause of land deterioration at eleven percent. The least affected of all was North America where only 5.4% of land was diminished, principally because of over-cultivation at 3.4%.
Mixed Charts
Learn how to answer this question in a step-by-step interactive exercise
Mixed Charts
Bij een opdracht met gecombineerde diagrammen in IELTS Academic Task 1 krijg je twee of meer visuals van verschillende soorten over één onderwerp. Je schrijft een verslag van minstens 150 woorden waarin je de hoofdkenmerken beschrijft en de visuals met elkaar verbindt, en je geeft geen meningen of redenen.
Bekijk de opdracht en klik dan op Volgende om door te gaan.
Bekijk de vraag vooraf
Summarise the information by selecting and reporting the main features, and make comparisons where relevant.
Write at least 150 words.
Begin met het lezen van de visuals, niet met schrijven. Kijk wat elke visual laat zien, en lees elk aslabel en elke eenheid voordat je gaat plannen. Visuals van verschillende soorten meten vaak verschillende dingen, dus noteer wat ze gemeen hebben, zoals dezelfde groep mensen of dezelfde periode.
Beantwoord de vragen over de visuals.
Lees het diagram
De inleiding parafraseert de opdracht in je eigen woorden. Maak duidelijk wat elke visual laat zien en over welke groep en periode die gaat, en verander de woorden van de opdracht in plaats van ze over te schrijven. Cijfers en verbanden tussen de visuals komen later.
Schrijf een of twee zinnen die de opdracht parafraseren.
Schrijf de inleiding
Opdrachtvraag
The pie graph depicts the main reasons for the productivity loss of agricultural land worldwide. The table shows how these causes influenced three world regions during the 2000s.
Summarise the information by selecting and reporting the main features, and make comparisons where relevant.
Write at least 150 words.
Een Task 1-verslag heeft één kernalinea per groep visuals nodig, en een set gecombineerde visuals geeft één tot drie groepen. Visuals van één soort of over één onderwerp horen bij elkaar, want een alinea die twee maten door elkaar haalt, is moeilijk te volgen. Twee cirkeldiagrammen over hetzelfde komen in één alinea, en een lijndiagram over een andere maat krijgt een eigen alinea.
Eén alinea per visual kan uit elkaar halen wat bij elkaar hoort, en één alinea voor alle visuals haalt maten door elkaar. Splitsen op jaren of op de hoogste en laagste cijfers breekt de vergelijking waar de opdracht om vraagt.
Kies de indeling die elke alinea één duidelijke maat geeft.
Maak de groepen
Kies de indeling die elke alinea één duidelijke maat geeft.
- Group 1: the pie chart. Group 2: the table.
- One group: the pie chart and the table.
Het overzicht noemt het grootste patroon in alle visuals samen, en het komt vóór alle details. Zoek de belangrijkste beweging in elke visual en bepaal dan of de ene visual de andere ondersteunt of verklaart. Precieze cijfers horen niet in het overzicht.
Kies de antwoorden die het belangrijkste patroon beschrijven.
Bepaal de algemene trend
Schrijf nu het overzicht in je eigen woorden, met de aantekeningen uit de vorige stap. Een of twee zinnen zijn genoeg. Noem het belangrijkste patroon en het verband tussen de visuals, en laat precieze cijfers en elke reden voor het patroon weg.
Schrijf je overzicht in een of twee zinnen.
Schrijf je overzicht
De eerste kernalinea beschrijft de eerste groep in detail. Noem de belangrijke vergelijkingen, zoals het hoogste punt, het laagste punt en de duidelijkste verandering, en onderbouw elke vergelijking met een paar gekozen cijfers. Som niet elk getal op, en beschrijf de andere groepen hier niet.
Schrijf drie of vier zinnen voor Kernalinea 1.
Schrijf kernalinea 1
De tweede kernalinea beschrijft de tweede groep en verbindt die met de eerste. Zet de vergelijkingen die bij elkaar horen samen in plaats van elke categorie om de beurt te behandelen, en gebruik een verbindende woordgroep om te laten zien waar de visuals overeenkomen. Beschrijf wat de gegevens laten zien, niet waarom.
Schrijf drie of vier zinnen voor Kernalinea 2.
Schrijf kernalinea 2
Je onderdelen vormen nu één verslag: inleiding, overzicht en één kernalinea per groep visuals. Lees ze op volgorde en controleer of het overzicht het grote geheel noemt en of de kernalinea's de details bevatten.
Lees je plan voor het verslag en vergelijk het dan met het modelverslag.
Volledig plan voor het verslag
Hoe je beslist
Bij een opdracht met gecombineerde diagrammen krijg je twee of meer afbeeldingen van verschillende typen over één onderwerp. Je schrijft geen apart verslag per afbeelding. Je meldt de belangrijkste kenmerken van elke afbeelding en legt verbanden waar de gegevens samenhangen.
Werk in een vaste volgorde, zodat het verslag eerst het grote geheel geeft en dan pas de details.
- Lees het diagram. Controleer wat elke afbeelding laat zien, en lees elke as, elk label en elke eenheid voordat je plant.
- Maak de groepen. Verdeel de afbeeldingen in één tot drie groepen, met één kernalinea per groep, meestal één diagramtype of onderwerp per groep.
- Bepaal de algemene trend. Bepaal het grootste patroon over alle afbeeldingen heen en noteer elk verband ertussen.
- Schrijf het verslag in fasen. Schrijf de inleiding, dan het overzicht en dan één kernalinea per groep.
- Volledig plan voor het verslag. Lees de onderdelen samen en vergelijk ze met het modelverslag.
Groepeer de belangrijke vergelijkingen in plaats van elk getal op te sommen. Een paar gekozen cijfers die een patroon onderbouwen, leveren meer op dan een lange lijst die alleen herhaalt wat de afbeelding al laat zien.
Lezen
Afbeeldingen van verschillende typen meten verschillende dingen, dus lees eerst elke afbeelding apart. Controleer de titel, de aslabels, de eenheden en de periode, en noteer dan wat de afbeeldingen gemeen hebben, zoals dezelfde groep mensen of dezelfde periode. Een aandeel tijd in een cirkeldiagram en een totaal in een lijndiagram zijn niet dezelfde maat.
Groepen
Een IELTS Task 1-verslag heeft één kernalinea per groep afbeeldingen, dus de afbeeldingen moeten in één, twee of drie groepen vallen. Afbeeldingen van hetzelfde type of over hetzelfde onderwerp horen bij elkaar, en een afbeelding die iets anders meet, krijgt een eigen alinea. Bepaal de verdeling voordat je schrijft, want die legt de volgorde van het hele verslag vast.
Overzicht
Het overzicht noemt in een of twee zinnen het grootste patroon over alle afbeeldingen heen. Zoek de belangrijkste beweging in elke afbeelding en bepaal dan of de ene afbeelding de andere ondersteunt of verklaart. Precieze cijfers en losse categorieën horen in de kernalinea's.
Schrijven
Het verslag wordt in korte fasen opgebouwd. De inleiding parafraseert de opdracht, het overzicht noemt het belangrijkste patroon en elke kernalinea beschrijft één groep. Groepeer in de kernalinea's de vergelijkingen die bij elkaar horen en onderbouw elke vergelijking met een paar gekozen cijfers in plaats van elk getal op te sommen.
Om te leren hoe je IELTS Academic Writing Taak 1 gemengde data aanpakt, meld je aan voor een gratis proefperiode van 7 dagen om toegang te krijgen tot de les IELTS Academic Writing Task - Mixed Data.
7 dagen gratis proefperiodeWoordenschat voor IELTS Academic Writing Taak 1
Om hoog te scoren op deze taak moet je leren passende woorden en zinnen te gebruiken om de gegeven data in een cirkel-/staaf-/lijn-/gemengde grafiek te presenteren. We raden je aan om je aan te melden voor een gratis proefperiode van 7 dagen en de volgende lessen te voltooien:
- IELTS Academic Writing Taak 1 Les - Hoe over getallen te schrijven
- IELTS Academic Writing Taak 1 Les - Hoe over percentages te schrijven
- IELTS Academic Writing Taak 1 Les - Hoe over veranderingen in gegevens te schrijven
IELTS Writing Taak 1 Voorbeelden
Deze sectie presenteert een lijst met IELTS Writing-voorbeelden voor IELTS Academic Writing Taak 1.
- IELTS Academic Writing Taak 1 - Lijngrafiekvragen
- IELTS Academic Writing Taak 1 - Staafdiagramvragen
- IELTS Academic Writing Taak 1 - Cirkeldiagramvragen
- IELTS Academic Writing Taak 1 - Kaartvragen
- IELTS Academic Writing Taak 1 - Procesdiagramvragen
- IELTS Academic Writing Taak 1 - Gemengde datavragen
IELTS General Writing Taak 1
Bij IELTS General Training Writing Taak 1 krijg je een situatie voorgelegd en moet je een persoonlijk antwoord schrijven in de vorm van een informele, halfformele of formele brief van minimaal 150 woorden. De situaties waarover je moet schrijven, zijn alledaagse situaties, zoals:
- schrijven aan een huisvestingscoördinator van een hogeschool over problemen met huisvesting,
- schrijven aan een nieuwe werkgever over problemen met tijdsindeling,
- schrijven aan een lokale krant over een plan om een lokaal vliegveld te ontwikkelen,
- schrijven aan een verhuurkantoor om problemen met het verwarmingssysteem in een huis op te lossen.
Met betrekking tot de situatie krijg je informatie in de vorm van drie opsommingstekens die je in je antwoord moet opnemen. Het kan zijn dat je informatie moet vragen of geven en/of een situatie moet uitleggen. Hiervoor moet je mogelijk enkele van de volgende dingen doen:
- algemene feitelijke informatie vragen en/of verstrekken,
- behoeften, wensen, voorkeuren of afkeer uitdrukken,
- meningen of klachten uiten,
- verzoeken doen of suggesties/aanbevelingen geven.
IELTS General Writing-stijl
De schrijfstijl die je gebruikt, hangt af van aan wie je geacht wordt te schrijven (d.w.z. het publiek) en hoe goed je deze persoon zou moeten kennen. Je moet schrijven in een stijl die geschikt is voor je publiek en die je helpt om je doel met schrijven te bereiken, bijv. schrijven aan een vriend (informeel) of schrijven aan een manager (halfformeel of formeel). Je hoeft geen adressen bovenaan je brieven op te nemen.
Hoe je puntenverlies in IELTS General Writing Taak 1 voorkomt
Zoals vermeld, besteed niet meer dan 20 minuten aan deze taak en zorg ervoor dat je minstens 150 woorden schrijft, anders word je bestraft. Hoewel je niet wordt bestraft voor het schrijven van meer dan 150 woorden, moet je onthouden dat een langer antwoord op taak 1 kan betekenen dat je minder tijd hebt voor taak 2, die twee keer zoveel bijdraagt aan de Writing-bandscore.
Houd er ook rekening mee dat je wordt bestraft voor irrelevantie als het antwoord buiten het onderwerp ligt of niet als volledige, samenhangende tekst is geschreven (bijv. door opsommingstekens te gebruiken in een deel van het antwoord, of in notitievorm, etc.). Je wordt zwaar bestraft voor plagiaat (d.w.z. het kopiëren uit een andere bron).
Last weekend, your cousin celebrated her 50th birthday, but you couldn't attend and you forgot to cancel.
Write a letter to your cousin. In your letter:
- Apologize for missing the birthday celebration
- Explain why you missed it and why you hadn't let her know
- Describe how you will make it up to her
You do NOT need to write any addresses.
Begin your letter as follows:
Dear ___,
- Write at least 150 words.
- You should spend around 20 minutes on this task.
Dear Marnie,
Happy belated birthday! I hope you're doing well and that you had a great 50th birthday party.
I'm so sorry that I wasn't at your party to celebrate with you. It's been such a long time since we've been able to catch up and see each other.
To be completely honest, I've been swamped with work lately, and I was asked to go on a last-minute business trip a few days before your birthday. I was so busy that I had completely forgotten about your party, and it didn't occur to me to call you and cancel.
My busy schedule is absolutely not an excuse for missing your 50th birthday, though, and I would love to make it up to you. I've reserved a table for two next Friday night at the new sushi restaurant in town. Can I please treat you to a luxurious birthday dinner?
I hope we can celebrate together next Friday!
Speak to you soon,
Jessica
Total Word Count: 162 words

Task Achievement — Letter
Learn how to answer this question in a step-by-step interactive exercise
Task Achievement — Letter
In IELTS General Training Task 1 schrijf je een brief als reactie op een situatie. Voor Task Achievement moet je elk opsommingspunt uit de opdracht behandelen, want een sterke brief die er één mist, verliest toch punten.
Lees de situatie, de opsommingspunten en een eventuele openingszin die de opdracht je geeft.
Bekijk de opdracht en klik dan op Volgende om door te gaan.
Bekijk de vraag vooraf
Write a letter to your cousin. In your letter:
- Apologize for missing the birthday celebration
- Explain why you missed it and why you hadn't let her know
- Describe how you will make it up to her
Write at least 150 words. You do NOT need to write any addresses.
Begin your letter as follows:
Dear ___,
Plan de brief voordat je gaat schrijven door drie vragen te beantwoorden. Aan wie schrijf je, waarom schrijf je en wat moet er in de brief staan?
De lezer bepaalt hoe formeel de taal moet zijn, het doel bepaalt hoe je opent, en de opsommingspunten bepalen de inhoud. Elk antwoord staat al ergens in de opdracht.
Koppel elke planningsvraag aan het deel van de opdracht dat haar beantwoordt.
Begrijp de opdracht
Koppel elke planningsvraag aan het deel van de opdracht dat haar beantwoordt.
De aanhef en de afsluiting vertellen de lezer hoe formeel de brief is, dus ze moeten passen bij de persoon aan wie je schrijft. Een brief aan een onbekende of een manager is formeel, en een brief aan een vriend is informeel.
Houd het begin en het einde van de brief op hetzelfde niveau. Een formele aanhef gevolgd door een losse afsluiting verwart de lezer.
Kies een aanhef en een afsluiting die bij de lezer passen.
Kies een aanhef en afsluiting
Confirm the greeting
- Dear ___,
- Dear Sir or Madam,
- Dear Ms. Smith,
- Hey you,
Choose a closing
- Speak to you soon,
- Lots of love,
- Best wishes,
- Yours faithfully,
- Yours sincerely,
Geef het eerste opsommingspunt een eigen alinea. Bij Task Achievement wordt beoordeeld of elk opsommingspunt behandeld en uitgewerkt is, niet alleen genoemd.
Er staan zinsbeginnen klaar om een zin mee te starten. Maak de gedachte af in je eigen woorden en houd dezelfde toon als in de aanhef.
Schrijf een alinea over het eerste opsommingspunt.
Werk opsommingspunt 1 uit
Apologise for missing the birthday celebration
Het tweede opsommingspunt heeft ook een eigen alinea nodig. Geef het dezelfde lengte en hetzelfde detail als het eerste, want een punt dat maar half beantwoord is, kost nog steeds punten.
Begin met een zinsbegin en voeg dan de details toe die de lezer in deze situatie echt nodig heeft.
Schrijf een alinea over het tweede opsommingspunt.
Werk opsommingspunt 2 uit
Explain why you missed it and did not let her know
Maak de kern van de brief af met het derde opsommingspunt. Zodra alle drie in volledige zinnen behandeld zijn, is de opdracht compleet.
Houd de toon tot het einde gelijk, en controleer of deze alinea antwoord geeft op wat het opsommingspunt echt vroeg.
Schrijf een alinea over het derde opsommingspunt.
Werk opsommingspunt 3 uit
Describe how you will make it up to her
Je alinea's staan nu samen als één brief, met de aanhef en de afsluiting op hun plaats. Lees hem als één tekst en controleer of elk opsommingspunt behandeld is.
Vergelijk je woorden met de voorbeeldbrief en let erop hoe de toon gelijk blijft van de aanhef tot de afsluiting.
Bekijk je brief en klik dan op Volgende om door te gaan.
Bekijk je volledige brief
Hoe je beslist
Een Task 1-brief reageert op een situatie en behandelt een reeks opsommingspunten. Je score voor Task Achievement hangt ervan af of je elk opsommingspunt behandelt en de toon afstemt op de lezer.
Werk in een vaste volgorde, zodat je geen opsommingspunt mist en de mate van formaliteit overal gelijk blijft.
- Begrijp de opdracht. Zoek uit aan wie je schrijft, waarom je schrijft en wat er in de brief moet staan.
- Kies een aanhef en afsluiting. Stem de aanhef en de afsluiting af op de lezer en houd beide even formeel.
- Werk de opsommingspunten uit. Geef elk opsommingspunt een eigen alinea en werk het uit met echte details.
- Bekijk je volledige brief. Lees de alinea's samen en controleer of elk opsommingspunt behandeld is.
Schrijf één alinea per opsommingspunt. Met dit eenvoudige plan is het bijna onmogelijk om een opsommingspunt te vergeten, en dat is de snelste manier om punten te verliezen voor Task Achievement.
Plan
Met drie vragen plan je de hele brief. Aan wie schrijf je, waarom schrijf je en wat moet er in de brief staan? Elk antwoord staat al ergens in de opdracht.
Toon
De aanhef en de afsluiting laten de lezer zien hoe formeel de brief is. Een brief aan een onbekende of een manager is formeel, een brief aan een vriend is informeel, en het begin en het eind van de brief moeten even formeel blijven.
Opsommingspunten
Elk opsommingspunt krijgt een eigen alinea. Behandel het in volledige zinnen met de details die de lezer echt nodig heeft, en maak de alinea's ongeveer even lang, zodat geen enkel punt afgeraffeld lijkt.
Voor meer informatie over IELTS General Writing Taak 1, bekijk The Ultimate Guide for the IELTS General Writing Task 1
IELTS Writing Taak 2
Bij IELTS Writing Taak 2 moet je een traditioneel essay schrijven als reactie op een vraag. Je moet minimaal 250 woorden schrijven. Als je niet genoeg woorden schrijft, word je bestraft. Er zijn 6 verschillende vraagtypen in taak 2. Laten we voorbeeldvragen en modelessays voor elk essaytype bekijken.
Oorzaken en gevolgen
Bij dit type vraag krijg je een probleem of situatie. Je taak is om de oorzaken van de situatie en enkele gevolgen van de situatie te beschrijven.
It is observed that in many countries not enough students are choosing to study science at university. What are the causes? And what will be the effects on society?
- Write at least 250 words.
- You should spend around 40 minutes on this task.
It is a fact that many students globally are avoiding science in favor of other subjects at university. Such a trend is largely due to how science is perceived, which may be having a detrimental effect on a nation’s development.
The primary reason for the drop in enrollment in science-based courses is that many undergraduates are put off by their difficulty. While many high school students enjoy science, they soon find themselves facing a lot of theory and research based courses once in college. For example according to a recent poll of UK universities, many students stated that while science was interesting in high school, there was too much theory learnt in classes, and not enough application in the lab to make it interesting. Furthermore, there are plenty of easier alternatives such as humanities for students to choose from these days. As a result, most choose a more appealing humanities degree over a science one.
Countries with the lowest science enrollment rates are affected the most competitively and economically. Fewer science graduates mean a shortage of skilled researchers in science-related fields like bio-engineering which reduces a countries competitiveness in attracting foreign investment. In other words foreign companies are usually unwilling to invest in nations with a low pool of skilled workers. In addition, a low number of skilled workers mean fewer technological developments for such countries, which may cause their economies to suffer from lost business in being the first to market with new products. For example, evidence shows that the number of patents filed by Chinese corporations is beginning to threaten the number credited to American ones.
In conclusion, there is a direct correlation between the perceived difficulty of science degrees and limited economic growth. Only by changing this attitude will countries reverse this trend.
Task Achievement — Task 2
Learn how to answer this question in a step-by-step interactive exercise
Task Achievement — Task 2
In IELTS Writing Task 2 schrijf je een essay dat elk deel van de vraag beantwoordt. Lees de stelling en de opdrachtregel zorgvuldig, en let op wat de vraag je laat bespreken.
Een essay dat bij het onderwerp blijft maar nooit de gestelde vraag beantwoordt, kan geen hoge bandscore halen.
Bekijk de vraag en klik dan op Volgende om door te gaan.
Bekijk de vraag vooraf
Laten we de inleiding schrijven in twee zinnen, samen ongeveer 25 tot 35 woorden. Herschrijf eerst de vraag in je eigen woorden. Parafraseer de vraag met je eigen woorden en synoniemen. Zo blijft je essay bij het onderwerp en laat je een brede woordenschat zien. De tweede zin noemt de specifieke onderwerpen die je in de kernalinea's bespreekt.
Schrijf een inleiding.
Schrijf de inleiding
Elke kernalinea heeft een kernzin nodig die het hoofdpunt introduceert. Twee kernalinea's zijn genoeg voor een essay van deze lengte.
Schrijf voor elke alinea één duidelijke zin. Houd elke zin op 12 tot 20 woorden en bewaar de uitleg en voorbeelden voor de volgende stappen.
Schrijf voor elke kernalinea één kernzin.
Schrijf twee kernzinnen
science courses are seen as too hard
fewer scientists hurt the economy
Een kernzin levert alleen punten op als hij onderbouwd wordt. Werk de eerste kernalinea uit met twee punten. Schrijf bij elk punt een uitleg en een concreet voorbeeld.
Elke kernalinea moet ongeveer 4–5 zinnen hebben, of 60 tot 80 woorden. Een concrete situatie is sterker dan een algemene uitspraak.
Schrijf de rest van de eerste kernalinea.
Werk kernalinea 1 uit
60
Geef de tweede kernalinea dezelfde diepgang als de eerste. Gebruik twee punten, en onderbouw elk punt met een uitleg en een voorbeeld.
Elke kernalinea moet ongeveer 4–5 zinnen hebben, of 60 tot 80 woorden. Herhaal de eerste alinea niet in andere woorden.
Schrijf de rest van de tweede kernalinea.
Werk kernalinea 2 uit
60
De conclusie rondt het essay af. Schrijf een samenvatting van twee zinnen van de hoofdpunten, en voeg daarna een of twee zinnen toe over waarom het onderwerp belangrijk is.
Kopieer de inleiding niet en voeg geen nieuw argument toe. Houd de hele conclusie op 35 tot 50 woorden.
Schrijf een conclusie van 3–4 zinnen.
Schrijf de conclusie
35
Je inleiding, kernzinnen, kernalinea's en conclusie staan nu samen als één essay. Lees het als één tekst en controleer of het elk deel van de vraag beantwoordt.
Vergelijk je woorden met het voorbeeldessay en let erop hoe elke alinea een andere taak heeft.
Bekijk je essay en klik dan op Volgende om door te gaan.
Bekijk je volledige essay
Hoe je beslist
Een Task 2-essay beantwoordt elk deel van de vraag. Je score voor Task Achievement hangt ervan af of je behandelt wat de vraag vraagt en elk hoofdpunt onderbouwt met een uitleg en een voorbeeld.
Werk in een vaste volgorde: inleiding, twee kernzinnen, twee uitgewerkte kernalinea's en dan een conclusie.
- Schrijf de inleiding.
Voor deze alinea heb je meestal twee zinnen nodig. Parafraseer de vraag met je eigen woorden en synoniemen. Zo blijft je essay bij het onderwerp en laat je zien dat je een brede woordenschat hebt. De tweede zin introduceert de specifieke onderwerpen die je in de kernalinea's bespreekt. Je inleiding bevat dus:
- De herschreven vraag
- Een introductie van de specifieke onderwerpen
- Schrijf twee kernzinnen. Schrijf voor elke kernalinea één kernzin.
- Werk de kernalinea's uit. Onderbouw elke kernalinea met twee punten, en geef elk punt een uitleg en een voorbeeld. Elke kernalinea telt ongeveer 4–5 zinnen.
- Schrijf de conclusie. Vat de hoofdpunten samen en zeg dan waarom het onderwerp belangrijk is.
- Bekijk je volledige essay. Lees de onderdelen samen en controleer of elk deel van de vraag beantwoord is.
Twee uitgewerkte alinea's scoren beter dan vier punten die niet zijn uitgewerkt. Examinatoren belonen onderbouwing, dus voeg liever een uitleg en een voorbeeld toe aan een punt dat je al hebt dan nog een punt erbij te zetten.
Inleiding
Voor deze alinea heb je meestal twee zinnen nodig. Parafraseer de vraag met je eigen woorden en synoniemen. Zo blijft je essay bij het onderwerp en laat je zien dat je een brede woordenschat hebt. De tweede zin introduceert de specifieke onderwerpen die je in de kernalinea's bespreekt. Je inleiding bevat dus:
- De herschreven vraag
- Een introductie van de specifieke onderwerpen
Kernzinnen
Schrijf voor elke kernalinea één kernzin. Elke zin introduceert het hoofdpunt van die alinea in 12 tot 20 woorden en bewaart de voorbeelden voor de volgende fase.
Onderbouwing
Een kernzin levert pas punten op als hij onderbouwd is. Leg uit waarom het punt klopt, geef een specifiek voorbeeld en geef beide kernalinea's evenveel onderbouwing. Elke kernalinea telt ongeveer 4–5 zinnen.
Conclusie
De conclusie vat de hoofdpunten in twee zinnen samen en voegt dan een of twee zinnen toe over waarom het onderwerp belangrijk is. Neem de inleiding niet over en voeg geen nieuw argument toe.
Bespreek beide standpunten en geef je eigen mening
Bij dit type vraag krijg je twee tegengestelde standpunten over een onderwerp. Meestal staan de twee standpunten in afzonderlijke zinnen die zijn verbonden door een overgangswoord zoals "however" om aan te geven dat de twee standpunten contrasteren. Je taak is om een betoog te schrijven, waarin je beide kanten van het onderwerp tegenover elkaar zet en je eigen mening presenteert.
Some people argue that the public should be allowed to have guns. Others do not agree. Discuss both points of view and give your opinion.
- Write at least 250 words.
- You should spend around 40 minutes on this task.
Gun ownership is a controversial topic with some people arguing that the public should have the choice to own them, while others disagree wholeheartedly with the idea. In my opinion, I believe that the public should only be entitled to own guns after having proper training.
The benefits of gun ownership are touted in some countries more than others. In countries where owning one is a civic right, like the United States, it is legal to use one in self-defense is legal. With muggings, murder and burglary rising in many countries, there may be some truth to the claim that owing a gun gives the owner increased security. Furthermore, in remote or dangerous areas, guns may be a necessity rather than an option. Without police nearby, properly stored, guns may be a great asset in deterring criminals from breaking and entering a remote property.
However, rather than deter violence, guns tend to escalate it in areas where they are widely available. Research shows that violent crime increases dramatically when guns are prevalent in society. When the public is armed, criminals and the police become so too, creating a situation in which guns beget more guns and eventually death. Additionally, greater ease of access is dangerous for children. Having a gun easily accessible may tempt children to abuse them as evidenced by the almost weekly school shootings in the US. There is further a proven link between increased suicide rates when guns are present.
It is my belief that the general public should be barred from owning guns of any kind. Also, guns should be restricted to specialists with a proven need for a firearm such as soldiers or hunters. While there are certain circumstances where owning a gun is an advantage, in the vast majority of situations there is no place for a gun in modern society.
Task Achievement — Task 2
Learn how to answer this question in a step-by-step interactive exercise
Task Achievement — Task 2
In IELTS Writing Task 2 schrijf je een essay dat elk deel van de vraag beantwoordt. Lees de stelling en de opdrachtregel zorgvuldig, en let op wat de vraag je laat bespreken.
Een essay dat bij het onderwerp blijft maar nooit de gestelde vraag beantwoordt, kan geen hoge bandscore halen.
Bekijk de vraag en klik dan op Volgende om door te gaan.
Bekijk de vraag vooraf
Laten we de inleiding schrijven in twee zinnen, samen ongeveer 25 tot 35 woorden. Herschrijf eerst de vraag in je eigen woorden. Parafraseer de vraag met je eigen woorden en synoniemen. Zo blijft je essay bij het onderwerp en laat je een brede woordenschat zien. De tweede zin noemt de specifieke onderwerpen die je in de kernalinea's bespreekt.
Schrijf een inleiding.
Schrijf de inleiding
Elke kernalinea heeft een kernzin nodig die het hoofdpunt introduceert. Twee kernalinea's zijn genoeg voor een essay van deze lengte.
Schrijf voor elke alinea één duidelijke zin. Houd elke zin op 12 tot 20 woorden en bewaar de uitleg en voorbeelden voor de volgende stappen.
Schrijf voor elke kernalinea één kernzin.
Schrijf twee kernzinnen
guns help people defend themselves
more guns lead to more violence
Een kernzin levert alleen punten op als hij onderbouwd wordt. Werk de eerste kernalinea uit met twee punten. Schrijf bij elk punt een uitleg en een concreet voorbeeld.
Elke kernalinea moet ongeveer 4–5 zinnen hebben, of 60 tot 80 woorden. Een concrete situatie is sterker dan een algemene uitspraak.
Schrijf de rest van de eerste kernalinea.
Werk kernalinea 1 uit
60
Geef de tweede kernalinea dezelfde diepgang als de eerste. Gebruik twee punten, en onderbouw elk punt met een uitleg en een voorbeeld.
Elke kernalinea moet ongeveer 4–5 zinnen hebben, of 60 tot 80 woorden. Herhaal de eerste alinea niet in andere woorden.
Schrijf de rest van de tweede kernalinea.
Werk kernalinea 2 uit
60
De conclusie rondt het essay af. Schrijf een samenvatting van twee zinnen van de hoofdpunten, en voeg daarna een of twee zinnen toe over waarom het onderwerp belangrijk is.
Kopieer de inleiding niet en voeg geen nieuw argument toe. Houd de hele conclusie op 35 tot 50 woorden.
Schrijf een conclusie van 3–4 zinnen.
Schrijf de conclusie
35
Je inleiding, kernzinnen, kernalinea's en conclusie staan nu samen als één essay. Lees het als één tekst en controleer of het elk deel van de vraag beantwoordt.
Vergelijk je woorden met het voorbeeldessay en let erop hoe elke alinea een andere taak heeft.
Bekijk je essay en klik dan op Volgende om door te gaan.
Bekijk je volledige essay
Hoe je beslist
Een Task 2-essay beantwoordt elk deel van de vraag. Je score voor Task Achievement hangt ervan af of je behandelt wat de vraag vraagt en elk hoofdpunt onderbouwt met een uitleg en een voorbeeld.
Werk in een vaste volgorde: inleiding, twee kernzinnen, twee uitgewerkte kernalinea's en dan een conclusie.
- Schrijf de inleiding.
Voor deze alinea heb je meestal twee zinnen nodig. Parafraseer de vraag met je eigen woorden en synoniemen. Zo blijft je essay bij het onderwerp en laat je zien dat je een brede woordenschat hebt. De tweede zin introduceert de specifieke onderwerpen die je in de kernalinea's bespreekt. Je inleiding bevat dus:
- De herschreven vraag
- Een introductie van de specifieke onderwerpen
- Schrijf twee kernzinnen. Schrijf voor elke kernalinea één kernzin.
- Werk de kernalinea's uit. Onderbouw elke kernalinea met twee punten, en geef elk punt een uitleg en een voorbeeld. Elke kernalinea telt ongeveer 4–5 zinnen.
- Schrijf de conclusie. Vat de hoofdpunten samen en zeg dan waarom het onderwerp belangrijk is.
- Bekijk je volledige essay. Lees de onderdelen samen en controleer of elk deel van de vraag beantwoord is.
Twee uitgewerkte alinea's scoren beter dan vier punten die niet zijn uitgewerkt. Examinatoren belonen onderbouwing, dus voeg liever een uitleg en een voorbeeld toe aan een punt dat je al hebt dan nog een punt erbij te zetten.
Inleiding
Voor deze alinea heb je meestal twee zinnen nodig. Parafraseer de vraag met je eigen woorden en synoniemen. Zo blijft je essay bij het onderwerp en laat je zien dat je een brede woordenschat hebt. De tweede zin introduceert de specifieke onderwerpen die je in de kernalinea's bespreekt. Je inleiding bevat dus:
- De herschreven vraag
- Een introductie van de specifieke onderwerpen
Kernzinnen
Schrijf voor elke kernalinea één kernzin. Elke zin introduceert het hoofdpunt van die alinea in 12 tot 20 woorden en bewaart de voorbeelden voor de volgende fase.
Onderbouwing
Een kernzin levert pas punten op als hij onderbouwd is. Leg uit waarom het punt klopt, geef een specifiek voorbeeld en geef beide kernalinea's evenveel onderbouwing. Elke kernalinea telt ongeveer 4–5 zinnen.
Conclusie
De conclusie vat de hoofdpunten in twee zinnen samen en voegt dan een of twee zinnen toe over waarom het onderwerp belangrijk is. Neem de inleiding niet over en voeg geen nieuw argument toe.
Voor- en nadelen
Bij dit type vraag wordt je gevraagd om de positieve en negatieve aspecten van een situatie, oplossing of trend te bespreken. Het kan ook zijn dat je wordt gevraagd om je mening te geven over welke kant je belangrijker vindt.
In some countries, governments are encouraging industries and businesses to move to regional areas outside the big cities. Do the advantages of this trend outweigh the disadvantages?
- Write at least 250 words.
- You should spend around 40 minutes on this task.
There is a movement among some countries to promote regional areas away from cities as attractive to business and industry. In my opinion, I consider relocation of business to bring about more drawbacks than benefits over the long term.
There are several attractive benefits to businesses moving to regional areas. For businesses rural locations mean lower land prices. Cheaper land allows large or small business equal prospects to become established cheaply with additional room to expand. As an example, the average size of a business in UK cities is currently 25 square meters while those in the rural locales average around 50m2. Additionally, countries benefits principally from the direct investment in underperforming parts of the country. Having companies operating in less urbanized areas, creates jobs, attracts talent and increases immigration which brings greater wealth.
On the other hand, relocation is not without its drawbacks. For one thing, locations away from population centers may mean a greater distance to market for goods. As a result, cost savings from cheaper land may be mitigated by the increased transportation costs of shipping products to customers. For another thing, there are often fewer skilled workers in regional areas. It may not be easy to attract employees to work in out-of-the-way places, which would mean longer commutes for staff from nearby cities at the expense of the company coffers. Lastly, increased business in country areas, disturbs the life of local residents. Country roads are not built for heavy trucks or traffic which may cause increased noise, congestions and inconvenience to those living nearby.
To sum up, while regional settings may be well suited to certain internet-based businesses, for more traditional companies, the distance from the city presents many challenges to overcome.
Task Achievement — Task 2
Learn how to answer this question in a step-by-step interactive exercise
Task Achievement — Task 2
In IELTS Writing Task 2 schrijf je een essay dat elk deel van de vraag beantwoordt. Lees de stelling en de opdrachtregel zorgvuldig, en let op wat de vraag je laat bespreken.
Een essay dat bij het onderwerp blijft maar nooit de gestelde vraag beantwoordt, kan geen hoge bandscore halen.
Bekijk de vraag en klik dan op Volgende om door te gaan.
Bekijk de vraag vooraf
Laten we de inleiding schrijven in twee zinnen, samen ongeveer 25 tot 35 woorden. Herschrijf eerst de vraag in je eigen woorden. Parafraseer de vraag met je eigen woorden en synoniemen. Zo blijft je essay bij het onderwerp en laat je een brede woordenschat zien. De tweede zin noemt de specifieke onderwerpen die je in de kernalinea's bespreekt.
Schrijf een inleiding.
Schrijf de inleiding
Elke kernalinea heeft een kernzin nodig die het hoofdpunt introduceert. Twee kernalinea's zijn genoeg voor een essay van deze lengte.
Schrijf voor elke alinea één duidelijke zin. Houd elke zin op 12 tot 20 woorden en bewaar de uitleg en voorbeelden voor de volgende stappen.
Schrijf voor elke kernalinea één kernzin.
Schrijf twee kernzinnen
cheaper land and new jobs in the regions
higher transport costs and fewer skilled workers
Een kernzin levert alleen punten op als hij onderbouwd wordt. Werk de eerste kernalinea uit met twee punten. Schrijf bij elk punt een uitleg en een concreet voorbeeld.
Elke kernalinea moet ongeveer 4–5 zinnen hebben, of 60 tot 80 woorden. Een concrete situatie is sterker dan een algemene uitspraak.
Schrijf de rest van de eerste kernalinea.
Werk kernalinea 1 uit
60
Geef de tweede kernalinea dezelfde diepgang als de eerste. Gebruik twee punten, en onderbouw elk punt met een uitleg en een voorbeeld.
Elke kernalinea moet ongeveer 4–5 zinnen hebben, of 60 tot 80 woorden. Herhaal de eerste alinea niet in andere woorden.
Schrijf de rest van de tweede kernalinea.
Werk kernalinea 2 uit
60
De conclusie rondt het essay af. Schrijf een samenvatting van twee zinnen van de hoofdpunten, en voeg daarna een of twee zinnen toe over waarom het onderwerp belangrijk is.
Kopieer de inleiding niet en voeg geen nieuw argument toe. Houd de hele conclusie op 35 tot 50 woorden.
Schrijf een conclusie van 3–4 zinnen.
Schrijf de conclusie
35
Je inleiding, kernzinnen, kernalinea's en conclusie staan nu samen als één essay. Lees het als één tekst en controleer of het elk deel van de vraag beantwoordt.
Vergelijk je woorden met het voorbeeldessay en let erop hoe elke alinea een andere taak heeft.
Bekijk je essay en klik dan op Volgende om door te gaan.
Bekijk je volledige essay
Hoe je beslist
Een Task 2-essay beantwoordt elk deel van de vraag. Je score voor Task Achievement hangt ervan af of je behandelt wat de vraag vraagt en elk hoofdpunt onderbouwt met een uitleg en een voorbeeld.
Werk in een vaste volgorde: inleiding, twee kernzinnen, twee uitgewerkte kernalinea's en dan een conclusie.
- Schrijf de inleiding.
Voor deze alinea heb je meestal twee zinnen nodig. Parafraseer de vraag met je eigen woorden en synoniemen. Zo blijft je essay bij het onderwerp en laat je zien dat je een brede woordenschat hebt. De tweede zin introduceert de specifieke onderwerpen die je in de kernalinea's bespreekt. Je inleiding bevat dus:
- De herschreven vraag
- Een introductie van de specifieke onderwerpen
- Schrijf twee kernzinnen. Schrijf voor elke kernalinea één kernzin.
- Werk de kernalinea's uit. Onderbouw elke kernalinea met twee punten, en geef elk punt een uitleg en een voorbeeld. Elke kernalinea telt ongeveer 4–5 zinnen.
- Schrijf de conclusie. Vat de hoofdpunten samen en zeg dan waarom het onderwerp belangrijk is.
- Bekijk je volledige essay. Lees de onderdelen samen en controleer of elk deel van de vraag beantwoord is.
Twee uitgewerkte alinea's scoren beter dan vier punten die niet zijn uitgewerkt. Examinatoren belonen onderbouwing, dus voeg liever een uitleg en een voorbeeld toe aan een punt dat je al hebt dan nog een punt erbij te zetten.
Inleiding
Voor deze alinea heb je meestal twee zinnen nodig. Parafraseer de vraag met je eigen woorden en synoniemen. Zo blijft je essay bij het onderwerp en laat je zien dat je een brede woordenschat hebt. De tweede zin introduceert de specifieke onderwerpen die je in de kernalinea's bespreekt. Je inleiding bevat dus:
- De herschreven vraag
- Een introductie van de specifieke onderwerpen
Kernzinnen
Schrijf voor elke kernalinea één kernzin. Elke zin introduceert het hoofdpunt van die alinea in 12 tot 20 woorden en bewaart de voorbeelden voor de volgende fase.
Onderbouwing
Een kernzin levert pas punten op als hij onderbouwd is. Leg uit waarom het punt klopt, geef een specifiek voorbeeld en geef beide kernalinea's evenveel onderbouwing. Elke kernalinea telt ongeveer 4–5 zinnen.
Conclusie
De conclusie vat de hoofdpunten in twee zinnen samen en voegt dan een of twee zinnen toe over waarom het onderwerp belangrijk is. Neem de inleiding niet over en voeg geen nieuw argument toe.
Problemen en oplossingen
Bij dit type vraag krijg je een probleem of situatie. Je taak is om de oorzaken van de situatie en enkele oplossingen voor het probleem te beschrijven. De vraag kan om algemene oplossingen vragen (bijv. Hoe zou dit probleem kunnen worden opgelost) of vragen hoe specifieke groepen het probleem kunnen oplossen (bijv. Welke stappen kunnen overheden en individuen nemen om het probleem aan te pakken?). Je hoeft de gevolgen niet in detail te noemen, alleen kort.
More and more wild animals are on the verge of extinction and others are on the endangered list. What are the reasons for this? What can be done to solve this problem?
- Write at least 250 words.
- You should spend around 40 minutes on this task.
The number of critically endangered animals is growing significantly, while a disturbing number of other species have become threatened. This worrying trend stems from several causes, though solutions exist where the will to implement them is present.
Regarding species on the critically endangered list, outmoded beliefs in Eastern medicine that endangered animal parts have medicinal qualities is driving demand for them, particularly in China. Animals are needlessly killed to cure ailments from infertility to arthritis, and China’s increasing affluence mean demand is expected to increase even further. Despite this, limited action by governments has proven ineffective at stopping such a trade. Many species threatened with extinction live in national parks, typically in developing countries. However, chronic underfunding means officials there are powerless to catch poachers, and corruption means the ones who are caught, often get away.
Where political will is available, several solutions may help. To begin with, developed countries could help fund budgets to protect endangered species in poorer countries. While this doesn’t solve the issue of corruption, it would increase deterrence and hopefully reduce the number of animals needlessly killed. More meaningfully, in countries where animal parts are bought and sold, laws should be more strictly enforced and punishments massively increased to discourage both sellers and buyers alike. A concerted education campaign should also be effected to stamp out the perception that animal parts have any curative properties to reduce the market for such ‘goods’ once and for all.
In conclusion, removing the market for animal parts, and better protecting the endangered animals that remain may help preserve the world’s natural heritage before it is too late.
Further reasons to consider:
Development destroying their habitat and food sourceGrowing cities and farmland encroach on habitatMany animals cannot find the place to raise their youngFurther solutions to consider:
Increase government budgets to protect animalsFor example, the panda is now rebounding in Southern China due to concerted government efforts to protect it.Task Achievement — Task 2
Learn how to answer this question in a step-by-step interactive exercise
Task Achievement — Task 2
In IELTS Writing Task 2 schrijf je een essay dat elk deel van de vraag beantwoordt. Lees de stelling en de opdrachtregel zorgvuldig, en let op wat de vraag je laat bespreken.
Een essay dat bij het onderwerp blijft maar nooit de gestelde vraag beantwoordt, kan geen hoge bandscore halen.
Bekijk de vraag en klik dan op Volgende om door te gaan.
Bekijk de vraag vooraf
Laten we de inleiding schrijven in twee zinnen, samen ongeveer 25 tot 35 woorden. Herschrijf eerst de vraag in je eigen woorden. Parafraseer de vraag met je eigen woorden en synoniemen. Zo blijft je essay bij het onderwerp en laat je een brede woordenschat zien. De tweede zin noemt de specifieke onderwerpen die je in de kernalinea's bespreekt.
Schrijf een inleiding.
Schrijf de inleiding
Elke kernalinea heeft een kernzin nodig die het hoofdpunt introduceert. Twee kernalinea's zijn genoeg voor een essay van deze lengte.
Schrijf voor elke alinea één duidelijke zin. Houd elke zin op 12 tot 20 woorden en bewaar de uitleg en voorbeelden voor de volgende stappen.
Schrijf voor elke kernalinea één kernzin.
Schrijf twee kernzinnen
animals are killed for traditional medicine
more funding, stricter laws and education
Een kernzin levert alleen punten op als hij onderbouwd wordt. Werk de eerste kernalinea uit met twee punten. Schrijf bij elk punt een uitleg en een concreet voorbeeld.
Elke kernalinea moet ongeveer 4–5 zinnen hebben, of 60 tot 80 woorden. Een concrete situatie is sterker dan een algemene uitspraak.
Schrijf de rest van de eerste kernalinea.
Werk kernalinea 1 uit
60
Geef de tweede kernalinea dezelfde diepgang als de eerste. Gebruik twee punten, en onderbouw elk punt met een uitleg en een voorbeeld.
Elke kernalinea moet ongeveer 4–5 zinnen hebben, of 60 tot 80 woorden. Herhaal de eerste alinea niet in andere woorden.
Schrijf de rest van de tweede kernalinea.
Werk kernalinea 2 uit
60
De conclusie rondt het essay af. Schrijf een samenvatting van twee zinnen van de hoofdpunten, en voeg daarna een of twee zinnen toe over waarom het onderwerp belangrijk is.
Kopieer de inleiding niet en voeg geen nieuw argument toe. Houd de hele conclusie op 35 tot 50 woorden.
Schrijf een conclusie van 3–4 zinnen.
Schrijf de conclusie
35
Je inleiding, kernzinnen, kernalinea's en conclusie staan nu samen als één essay. Lees het als één tekst en controleer of het elk deel van de vraag beantwoordt.
Vergelijk je woorden met het voorbeeldessay en let erop hoe elke alinea een andere taak heeft.
Bekijk je essay en klik dan op Volgende om door te gaan.
Bekijk je volledige essay
Hoe je beslist
Een Task 2-essay beantwoordt elk deel van de vraag. Je score voor Task Achievement hangt ervan af of je behandelt wat de vraag vraagt en elk hoofdpunt onderbouwt met een uitleg en een voorbeeld.
Werk in een vaste volgorde: inleiding, twee kernzinnen, twee uitgewerkte kernalinea's en dan een conclusie.
- Schrijf de inleiding.
Voor deze alinea heb je meestal twee zinnen nodig. Parafraseer de vraag met je eigen woorden en synoniemen. Zo blijft je essay bij het onderwerp en laat je zien dat je een brede woordenschat hebt. De tweede zin introduceert de specifieke onderwerpen die je in de kernalinea's bespreekt. Je inleiding bevat dus:
- De herschreven vraag
- Een introductie van de specifieke onderwerpen
- Schrijf twee kernzinnen. Schrijf voor elke kernalinea één kernzin.
- Werk de kernalinea's uit. Onderbouw elke kernalinea met twee punten, en geef elk punt een uitleg en een voorbeeld. Elke kernalinea telt ongeveer 4–5 zinnen.
- Schrijf de conclusie. Vat de hoofdpunten samen en zeg dan waarom het onderwerp belangrijk is.
- Bekijk je volledige essay. Lees de onderdelen samen en controleer of elk deel van de vraag beantwoord is.
Twee uitgewerkte alinea's scoren beter dan vier punten die niet zijn uitgewerkt. Examinatoren belonen onderbouwing, dus voeg liever een uitleg en een voorbeeld toe aan een punt dat je al hebt dan nog een punt erbij te zetten.
Inleiding
Voor deze alinea heb je meestal twee zinnen nodig. Parafraseer de vraag met je eigen woorden en synoniemen. Zo blijft je essay bij het onderwerp en laat je zien dat je een brede woordenschat hebt. De tweede zin introduceert de specifieke onderwerpen die je in de kernalinea's bespreekt. Je inleiding bevat dus:
- De herschreven vraag
- Een introductie van de specifieke onderwerpen
Kernzinnen
Schrijf voor elke kernalinea één kernzin. Elke zin introduceert het hoofdpunt van die alinea in 12 tot 20 woorden en bewaart de voorbeelden voor de volgende fase.
Onderbouwing
Een kernzin levert pas punten op als hij onderbouwd is. Leg uit waarom het punt klopt, geef een specifiek voorbeeld en geef beide kernalinea's evenveel onderbouwing. Elke kernalinea telt ongeveer 4–5 zinnen.
Conclusie
De conclusie vat de hoofdpunten in twee zinnen samen en voegt dan een of twee zinnen toe over waarom het onderwerp belangrijk is. Neem de inleiding niet over en voeg geen nieuw argument toe.
Tweedelige vraag
Bij dit type vraag krijg je twee vragen en moet je beide beantwoorden. De twee vragen zullen verschillend zijn. Je moet bijvoorbeeld het belang van een idee of actie beoordelen (bijv. Hoe belangrijk is het?) en aangeven of je het ermee eens of oneens bent (bijv. Ben je het ermee eens of oneens?).
News editors decide what to broadcast on television and what to print in newspapers. What factors do you think influence these decisions? Do you think that there is too much emphasis on bad news these days?
- Write at least 250 words.
- You should spend around 40 minutes on this task.
In the news business, editors have the final say in what makes it to air, or what makes it to print in newspapers. There are a variety of factors that affect their decision making; however, in my opinion, the public is inundated with negative news content, and more positive news would be beneficial to all.
Regarding news stories worth focusing on, editors must weigh up a number of aspects. For one thing, timing is a major factor in choosing stories to inform the public, especially ones that affect many people. Stories that happen right away are classified as newsworthy, however, if the same story happens again, it’s no longer interesting. For another, proximity to a story is important. Stories that happen closer to home become more newsworthy than those far away, so domestic news stories become more noteworthy than international ones. Finally, human interest stories always garner attention since they don’t date quickly, and often offer an emotion connection with the audience.
However, to my mind most news shared with the public is of a negative slant. Through TV, print and online media, society is inundated with stories of crime, disasters, and war to the point that the good news becomes exceptional. As a result, people have become accustomed to this trend and become more anxious about the state of the world. For this reason, I believe having a greater proportion of positive news in the media would benefit everyone. Stories of human interest, scientific discovery or human achievement help everyone understand the world around them, and make better decisions. That way, society can better understand the world rather than simply view it as a dangerous place.
In conclusion, although news editors face a lot of challenges in choosing newsworthy stories, I believe a more optimistic approach would add further value to the news profession.
Task Achievement — Task 2
Learn how to answer this question in a step-by-step interactive exercise
Task Achievement — Task 2
In IELTS Writing Task 2 schrijf je een essay dat elk deel van de vraag beantwoordt. Lees de stelling en de opdrachtregel zorgvuldig, en let op wat de vraag je laat bespreken.
Een essay dat bij het onderwerp blijft maar nooit de gestelde vraag beantwoordt, kan geen hoge bandscore halen.
Bekijk de vraag en klik dan op Volgende om door te gaan.
Bekijk de vraag vooraf
Laten we de inleiding schrijven in twee zinnen, samen ongeveer 25 tot 35 woorden. Herschrijf eerst de vraag in je eigen woorden. Parafraseer de vraag met je eigen woorden en synoniemen. Zo blijft je essay bij het onderwerp en laat je een brede woordenschat zien. De tweede zin noemt de specifieke onderwerpen die je in de kernalinea's bespreekt.
Schrijf een inleiding.
Schrijf de inleiding
Elke kernalinea heeft een kernzin nodig die het hoofdpunt introduceert. Twee kernalinea's zijn genoeg voor een essay van deze lengte.
Schrijf voor elke alinea één duidelijke zin. Houd elke zin op 12 tot 20 woorden en bewaar de uitleg en voorbeelden voor de volgende stappen.
Schrijf voor elke kernalinea één kernzin.
Schrijf twee kernzinnen
timing, distance and human interest
too much bad news makes people anxious
Een kernzin levert alleen punten op als hij onderbouwd wordt. Werk de eerste kernalinea uit met twee punten. Schrijf bij elk punt een uitleg en een concreet voorbeeld.
Elke kernalinea moet ongeveer 4–5 zinnen hebben, of 60 tot 80 woorden. Een concrete situatie is sterker dan een algemene uitspraak.
Schrijf de rest van de eerste kernalinea.
Werk kernalinea 1 uit
60
Geef de tweede kernalinea dezelfde diepgang als de eerste. Gebruik twee punten, en onderbouw elk punt met een uitleg en een voorbeeld.
Elke kernalinea moet ongeveer 4–5 zinnen hebben, of 60 tot 80 woorden. Herhaal de eerste alinea niet in andere woorden.
Schrijf de rest van de tweede kernalinea.
Werk kernalinea 2 uit
60
De conclusie rondt het essay af. Schrijf een samenvatting van twee zinnen van de hoofdpunten, en voeg daarna een of twee zinnen toe over waarom het onderwerp belangrijk is.
Kopieer de inleiding niet en voeg geen nieuw argument toe. Houd de hele conclusie op 35 tot 50 woorden.
Schrijf een conclusie van 3–4 zinnen.
Schrijf de conclusie
35
Je inleiding, kernzinnen, kernalinea's en conclusie staan nu samen als één essay. Lees het als één tekst en controleer of het elk deel van de vraag beantwoordt.
Vergelijk je woorden met het voorbeeldessay en let erop hoe elke alinea een andere taak heeft.
Bekijk je essay en klik dan op Volgende om door te gaan.
Bekijk je volledige essay
Hoe je beslist
Een Task 2-essay beantwoordt elk deel van de vraag. Je score voor Task Achievement hangt ervan af of je behandelt wat de vraag vraagt en elk hoofdpunt onderbouwt met een uitleg en een voorbeeld.
Werk in een vaste volgorde: inleiding, twee kernzinnen, twee uitgewerkte kernalinea's en dan een conclusie.
- Schrijf de inleiding.
Voor deze alinea heb je meestal twee zinnen nodig. Parafraseer de vraag met je eigen woorden en synoniemen. Zo blijft je essay bij het onderwerp en laat je zien dat je een brede woordenschat hebt. De tweede zin introduceert de specifieke onderwerpen die je in de kernalinea's bespreekt. Je inleiding bevat dus:
- De herschreven vraag
- Een introductie van de specifieke onderwerpen
- Schrijf twee kernzinnen. Schrijf voor elke kernalinea één kernzin.
- Werk de kernalinea's uit. Onderbouw elke kernalinea met twee punten, en geef elk punt een uitleg en een voorbeeld. Elke kernalinea telt ongeveer 4–5 zinnen.
- Schrijf de conclusie. Vat de hoofdpunten samen en zeg dan waarom het onderwerp belangrijk is.
- Bekijk je volledige essay. Lees de onderdelen samen en controleer of elk deel van de vraag beantwoord is.
Twee uitgewerkte alinea's scoren beter dan vier punten die niet zijn uitgewerkt. Examinatoren belonen onderbouwing, dus voeg liever een uitleg en een voorbeeld toe aan een punt dat je al hebt dan nog een punt erbij te zetten.
Inleiding
Voor deze alinea heb je meestal twee zinnen nodig. Parafraseer de vraag met je eigen woorden en synoniemen. Zo blijft je essay bij het onderwerp en laat je zien dat je een brede woordenschat hebt. De tweede zin introduceert de specifieke onderwerpen die je in de kernalinea's bespreekt. Je inleiding bevat dus:
- De herschreven vraag
- Een introductie van de specifieke onderwerpen
Kernzinnen
Schrijf voor elke kernalinea één kernzin. Elke zin introduceert het hoofdpunt van die alinea in 12 tot 20 woorden en bewaart de voorbeelden voor de volgende fase.
Onderbouwing
Een kernzin levert pas punten op als hij onderbouwd is. Leg uit waarom het punt klopt, geef een specifiek voorbeeld en geef beide kernalinea's evenveel onderbouwing. Elke kernalinea telt ongeveer 4–5 zinnen.
Conclusie
De conclusie vat de hoofdpunten in twee zinnen samen en voegt dan een of twee zinnen toe over waarom het onderwerp belangrijk is. Neem de inleiding niet over en voeg geen nieuw argument toe.
Mening
Bij dit type vraag krijg je een vraag die een mening bevat. Je taak is om een essay te schrijven als reactie op de mening. Dit type vraag vraagt vaak of je het eens of oneens bent met een mening.
Some people are concerned that children spend too much time on computers – playing games, chatting and watching videos. But all this time is actually good preparation for children, who will have to spend many hours working on computers throughout their education and their working lives.To what extent do you agree or disagree with this statement?
- Write at least 250 words.
- You should spend around 40 minutes on this task.
With all the time that children spend engaged in various activities on computers, some people believe this is good preparation for a future in which many will work on computers full time through school and at work. I completely oppose this belief for several reasons.
To begin with, time on computers learning computer skills cannot be equated with that spent playing games or chatting online. While there may be some truth that videos games increase problem solving and analytical skills, there is no evidence to suggest that they improve other workplace skills. The skills children really need in a future work place are coding, designing, and software skills to name a few. The only way to ensure they learn these is for adults to be on hand to teach and supervise such learning.
Furthermore, spending too much time online may further have negative consequences to a child’s mental health. Unsupervised time on computers can result in children encountering inappropriate content online. Children have an extremely short attention span so are easily distracted by what they see or encounter online. There’s also the very real risk that children become addicted to the video games they play. Video game addiction is a proven disorder and affects many children in the US today. The quick-reward based system of such games is attractive and negatively affects how children learn and are motivated.
In conclusion, unless a child wishes to be a video game designer, increased computer time not only has little value to them beyond entertainment, it may even negatively affect a child’s development in the long term. Children should be supervised by adults when using computers to ensure they learn what they’re supposed to.
Task Achievement — Task 2
Learn how to answer this question in a step-by-step interactive exercise
Task Achievement — Task 2
In IELTS Writing Task 2 schrijf je een essay dat elk deel van de vraag beantwoordt. Lees de stelling en de opdrachtregel zorgvuldig, en let op wat de vraag je laat bespreken.
Een essay dat bij het onderwerp blijft maar nooit de gestelde vraag beantwoordt, kan geen hoge bandscore halen.
Bekijk de vraag en klik dan op Volgende om door te gaan.
Bekijk de vraag vooraf
Laten we de inleiding schrijven in twee zinnen, samen ongeveer 25 tot 35 woorden. Herschrijf eerst de vraag in je eigen woorden. Parafraseer de vraag met je eigen woorden en synoniemen. Zo blijft je essay bij het onderwerp en laat je een brede woordenschat zien. De tweede zin noemt de specifieke onderwerpen die je in de kernalinea's bespreekt.
Schrijf een inleiding.
Schrijf de inleiding
Elke kernalinea heeft een kernzin nodig die het hoofdpunt introduceert. Twee kernalinea's zijn genoeg voor een essay van deze lengte.
Schrijf voor elke alinea één duidelijke zin. Houd elke zin op 12 tot 20 woorden en bewaar de uitleg en voorbeelden voor de volgende stappen.
Schrijf voor elke kernalinea één kernzin.
Schrijf twee kernzinnen
games do not teach work skills
too much screen time harms children
Een kernzin levert alleen punten op als hij onderbouwd wordt. Werk de eerste kernalinea uit met twee punten. Schrijf bij elk punt een uitleg en een concreet voorbeeld.
Elke kernalinea moet ongeveer 4–5 zinnen hebben, of 60 tot 80 woorden. Een concrete situatie is sterker dan een algemene uitspraak.
Schrijf de rest van de eerste kernalinea.
Werk kernalinea 1 uit
60
Geef de tweede kernalinea dezelfde diepgang als de eerste. Gebruik twee punten, en onderbouw elk punt met een uitleg en een voorbeeld.
Elke kernalinea moet ongeveer 4–5 zinnen hebben, of 60 tot 80 woorden. Herhaal de eerste alinea niet in andere woorden.
Schrijf de rest van de tweede kernalinea.
Werk kernalinea 2 uit
60
De conclusie rondt het essay af. Schrijf een samenvatting van twee zinnen van de hoofdpunten, en voeg daarna een of twee zinnen toe over waarom het onderwerp belangrijk is.
Kopieer de inleiding niet en voeg geen nieuw argument toe. Houd de hele conclusie op 35 tot 50 woorden.
Schrijf een conclusie van 3–4 zinnen.
Schrijf de conclusie
35
Je inleiding, kernzinnen, kernalinea's en conclusie staan nu samen als één essay. Lees het als één tekst en controleer of het elk deel van de vraag beantwoordt.
Vergelijk je woorden met het voorbeeldessay en let erop hoe elke alinea een andere taak heeft.
Bekijk je essay en klik dan op Volgende om door te gaan.
Bekijk je volledige essay
Hoe je beslist
Een Task 2-essay beantwoordt elk deel van de vraag. Je score voor Task Achievement hangt ervan af of je behandelt wat de vraag vraagt en elk hoofdpunt onderbouwt met een uitleg en een voorbeeld.
Werk in een vaste volgorde: inleiding, twee kernzinnen, twee uitgewerkte kernalinea's en dan een conclusie.
- Schrijf de inleiding.
Voor deze alinea heb je meestal twee zinnen nodig. Parafraseer de vraag met je eigen woorden en synoniemen. Zo blijft je essay bij het onderwerp en laat je zien dat je een brede woordenschat hebt. De tweede zin introduceert de specifieke onderwerpen die je in de kernalinea's bespreekt. Je inleiding bevat dus:
- De herschreven vraag
- Een introductie van de specifieke onderwerpen
- Schrijf twee kernzinnen. Schrijf voor elke kernalinea één kernzin.
- Werk de kernalinea's uit. Onderbouw elke kernalinea met twee punten, en geef elk punt een uitleg en een voorbeeld. Elke kernalinea telt ongeveer 4–5 zinnen.
- Schrijf de conclusie. Vat de hoofdpunten samen en zeg dan waarom het onderwerp belangrijk is.
- Bekijk je volledige essay. Lees de onderdelen samen en controleer of elk deel van de vraag beantwoord is.
Twee uitgewerkte alinea's scoren beter dan vier punten die niet zijn uitgewerkt. Examinatoren belonen onderbouwing, dus voeg liever een uitleg en een voorbeeld toe aan een punt dat je al hebt dan nog een punt erbij te zetten.
Inleiding
Voor deze alinea heb je meestal twee zinnen nodig. Parafraseer de vraag met je eigen woorden en synoniemen. Zo blijft je essay bij het onderwerp en laat je zien dat je een brede woordenschat hebt. De tweede zin introduceert de specifieke onderwerpen die je in de kernalinea's bespreekt. Je inleiding bevat dus:
- De herschreven vraag
- Een introductie van de specifieke onderwerpen
Kernzinnen
Schrijf voor elke kernalinea één kernzin. Elke zin introduceert het hoofdpunt van die alinea in 12 tot 20 woorden en bewaart de voorbeelden voor de volgende fase.
Onderbouwing
Een kernzin levert pas punten op als hij onderbouwd is. Leg uit waarom het punt klopt, geef een specifiek voorbeeld en geef beide kernalinea's evenveel onderbouwing. Elke kernalinea telt ongeveer 4–5 zinnen.
Conclusie
De conclusie vat de hoofdpunten in twee zinnen samen en voegt dan een of twee zinnen toe over waarom het onderwerp belangrijk is. Neem de inleiding niet over en voeg geen nieuw argument toe.
IELTS Writing-voorbeelden en strategieën voor IELTS Writing Taak 2
In het algemeen zijn er 4 stappen om IELTS Writing Taak 2 aan te pakken:
1. Lees en begrijp - Hoewel deze stap voor zichzelf lijkt te spreken, laten veel kandidaten hun zenuwen de overhand krijgen en begrijpen ze de gestelde vraag niet volledig. Daarom is het eerste wat je moet doen tijdens Writing Taak 2 de vraag volledig begrijpen en kernwoorden onderstrepen. Denk ook aan deze twee dingen:
- Welk type essay moet ik schrijven? (Het kan bijvoorbeeld Probleem en Oplossing zijn).
- Hoe vertrouwd ben ik met dit onderwerp? (Deze vraag is belangrijk, omdat het de schets die je kiest kan beïnvloeden.
2. Plan je schets - Nu je hebt begrepen wat de vraag vraagt en welk type essay je moet schrijven, ben je klaar om je schets uit te werken. Sla deze stap niet over. Dit zou slechts 2 of 3 minuten moeten kosten en zal als referentie voor je dienen. Afhankelijk van hoe de vraag wordt gesteld, zal de schets ook verschillen. Om te leren hoe je een vraag analyseert en de schets voor elk essaytype plant, bekijk onze IELTS Writing Taak 2-lessen
3. Maak schetsnotities - Nu je je schets hebt gekozen en opgesteld, maak je notities in je schets met behulp van kernwoorden van de hoofdzinnen van elke paragraaf. Dit helpt je om je essay "in kaart te brengen" en geeft je een vogelperspectief van hoe het eruit zal zien. In dit stadium zou je al in staat moeten zijn om de hoofdonderwerpen van elke paragraaf te begrijpen.4. Begin met schrijven - Na het plannen van je schets begin je met het schrijven van je inleiding en gaat van daaruit verder. Zorg ervoor dat je een formele toon gebruikt (gebruik geen samentrekkingen, schrijf getallen kleiner dan 10 voluit, etc.) en spring na elke paragraaf in.
De volgende blogposts leren je hoe je elk vraagtype kunt aanpakken en bevatten meer dan 100 IELTS Writing Taak 2-vragen en voorbeeldessays. Voel je vrij om ze te gebruiken voor je IELTS-voorbereiding.
- Hoe meningvraagtypen in IELTS Writing Taak 2 te beantwoorden
- Hoe discussievraagtypen in IELTS Writing Taak 2 te beantwoorden
- Hoe voor- en nadeelvraagtypen in IELTS Writing Taak 2 te beantwoorden
- Hoe probleem- en oplossingsvraagtypen in IELTS Writing Taak 2 te beantwoorden
- Hoe oorzaak- en gevolgvraagtypen in IELTS Writing Taak 2 te beantwoorden
- Hoe tweedelige vraagtypen in IELTS Writing Taak 2 te beantwoorden