
У цьому посібнику ви навчитеся писати високобальні есе для IELTS writing task 1 та IELTS writing task 2. Який би тест ви не складали — академічний чи загальний, — ми вас повністю забезпечимо: посібник містить зразки творів IELTS, теми та детальні уроки з general writing task 1 і 2 та academic writing task 1 і 2.
Отримайте безкоштовні зразки відповідей IELTS Writing після проходження практичного тесту IELTS Writing.
| Тест IELTS General Writing | Тест IELTS Academic Writing |
|---|---|
Нижче наведено повний список наших запитань IELTS Writing зі зразками есе. Примітка: червоні посилання ведуть до наших найпопулярніших і рекомендованих запитань writing, які високо оцінили наші учні, і ви можете безкоштовно практикуватися на них будь-коли.
Зразки IELTS General Writing Task 1 1 - 44
Informal, formal, & semi-formal letters
Зразки IELTS Academic Writing Task 1 1 - 52
Line graphs, bar charts, pie charts, tables, maps, flow charts, & multiple charts
Зразки IELTS Writing Task 2 1 - 96
Opinion, discussion, advantages & disadvantages, problem & solution, cause & effect, & two-part questions
Зміст
Інформація про тест IELTS Writing
Тест із письма складається з 2 письмових завдань, і у вас буде загалом 60 хвилин на виконання обох. Ви можете виконувати завдання у будь-якому порядку, лише переконайтеся, що ви добре розподіляєте свій час і витрачаєте близько 20 хвилин на IELTS writing task 1 та 40 хвилин на IELTS writing task 2.
IELTS Academic Writing Task проти IELTS General Writing Task
IELTS пропонує дві версії тесту. Версія Academic призначена для людей, які шукають вищу освіту, тоді як версія General Training — для тих, хто хоче просто емігрувати або, можливо, отримати нижчий рівень освіти. Існує більше критеріїв для обох версій, тому, будь ласка, зв'яжіться зі службою підтримки IELTS, щоб дізнатися, який тест підходить саме вам.
Який же тест складніший? Академічний тест, як ви могли здогадатися, складніший за тест general training. Різниця між двома полягає у складності IELTS writing task 1. На щастя, відрізняється лише Writing Task 1. IELTS writing task 2 однаковий для обох версій тесту. Таблиця нижче підсумовує два типи тесту IELTS writing.
| Тип тесту | Task 1 | Task 2 |
|---|---|---|
| Academic Writing | IELTS Academic Writing Task 1
В IELTS academic writing task 1 вам подають графік, таблицю, діаграму чи схему та просять описати, узагальнити чи пояснити інформацію своїми словами. |
IELTS Writing Task 2 В IELTS writing task 2 вам потрібно буде написати есе традиційного стилю у відповідь на запитання. Ви маєте написати щонайменше 250 слів |
| General Writing |
IELTS General Writing Task 1
В IELTS General Writing Task 1 вас просять написати листа про дану ситуацію. Цей лист буде одного з таких типів: - Формальний (Формальні листи відправляють людям, яких ми не знаємо або ніколи не зустрічали.) - Напівформальний (Напівформальні листи відправляють людям, яких ми знаємо не дуже добре.) - Неформальний (Неформальні листи відправляють людям, яких ми знаємо добре, наприклад нашим друзям) |
Відеоогляд IELTS Academic Writing Task
Відеоогляд IELTS General Writing Task
Скоро!
Як оцінюється тест IELTS Writing
У тесті IELTS writing ваш бал за письмо буде оцінюватися на основі чотирьох категорій. Вони відомі як
Task Achievement/Task Response, Coherence and Cohesion, Lexical Resource та Grammatical Range and Accuracy.
Зверніться до наступних описів діапазонів балів, які екзаменатори IELTS використовують для оцінки розділу письма тесту:
- Описи діапазонів IELTS Writing Task 1
- Описи діапазонів IELTS Writing Task 2
Зверніть увагу, що критерії оцінювання для обох завдань включають:
- Task Achievement/Task Response - Чи повністю ви відповіли на запитання та подали повністю розгорнуту відповідь?
- Coherence and Cohesion - Чи має сенс ваш аргумент чи аналіз? Чи добре він продуманий і поданий у повній формі?
- Lexical Resource – Чи використовували ви широкий спектр лексики у природному, формальному тоні?
- Grammatical Range and Accuracy – Чи практично ваше есе без помилок? Чи вдалося вам використати широкий спектр граматичних конструкцій?
Чи коштують IELTS Writing Task 1 та IELTS Writing Task 2 однакової кількості балів?
Так само, як ви витратите вдвічі більше часу на написання IELTS writing task 2,
воно також коштує приблизно вдвічі більше балів. Це не зовсім вдвічі.
Інший спосіб подивитися на це — додати бал за writing task 2 двічі. Тож візьміть
band score 7 для task one і 4 для task two, і ви отримаєте таку
формулу для розрахунку вашого балу IELTS writing:
(7 + (4 x 2))/3 = 5.
Тому загальний band score IELTS writing становить близько 4.5 - 6. Бачите, ми не можемо дати точне число,
бо IELTS не зробив свою формулу підрахунку загальнодоступною, але представлена тут формула
достатньо точна з різницею близько 0.5 балів.
Що показують 19 000 оцінених есе IELTS
У період із 2020 до 2026 року викладачі BestMyTest оцінили близько 9 400 письмових робіт IELTS, а наша система перевірки на основі ШІ виправила ще 9 614 есе. Виділяються три моменти.
- Граматика визначає бал. Граматична різноманітність і точність (Grammatical Range and Accuracy) була найслабшим із чотирьох критеріїв у 91% есе Task 2, 84% звітів Academic Task 1 і 94% листів General Training. Середні оцінки викладачів за Task 2: граматика — 5.5, лексичний ресурс (Lexical Resource) — 6.0, логічність і зв’язність (Coherence and Cohesion) — 6.1, відповідь на завдання (Task Response) — 6.1. Для Academic Task 1: граматика — 5.5, логічність — 5.8, виконання завдання (Task Achievement) — 5.8, лексичний ресурс — 5.8. Для General Training Task 1: граматика — 5.3, лексичний ресурс — 5.9, логічність — 6.0, виконання завдання — 6.2.
- Короткі есе отримують нижчі бали. 17% есе Task 2 не досягали мінімального обсягу в 250 слів, і їхня середня оцінка за відповідь на завдання становила 4.9 проти 6.1 для есе обсягом щонайменше 250 слів. 13% звітів Academic Task 1 і 16% листів General Training містили менше ніж 150 слів. Середній обсяг робіт наших учнів становить 285 слів для Task 2 і близько 175 слів для Task 1.
- Помилки дрібні й повторювані. В есе Task 2 вносять близько 21 виправлення. Лідирує пунктуація (17% виправлень), далі йдуть артиклі (11%), правопис (10%), однина та множина іменників (9%), узгодження підмета з присудком (7%) і прийменники (6%). Дві третини есе Task 2 містили помилку у вживанні артикля, а 58% — помилку в узгодженні підмета з присудком. В Academic Task 1 лексика для опису даних спричиняє додаткові помилки: "male" на "males", "increase" на "increased", "compare" на "compared". У листах General Training вживання великих літер (9% виправлень) і часи дієслів (6%) відіграють більшу роль, ніж в інших завданнях.
- Найчастіші виправлення під час нашої перевірки: "this" на "these", "is" на "are", "have" на "has", "in" на "on", "of" на "for", "amount" на "number", "then" на "than", "that" на "who", "goverment" на "government", "belive" на "believe", "accomodation" на "accommodation".
Показники взято з даних пробних тестів і перевірок BestMyTest станом на жовтень 2026 року. Відсотки за типами запитань — це частки правильних відповідей серед усіх спроб; показники за критеріями — це оцінки викладачів або ШІ, як зазначено. Останнє оновлення: 5 жовтня 2026 року.
IELTS Academic Writing Task 1
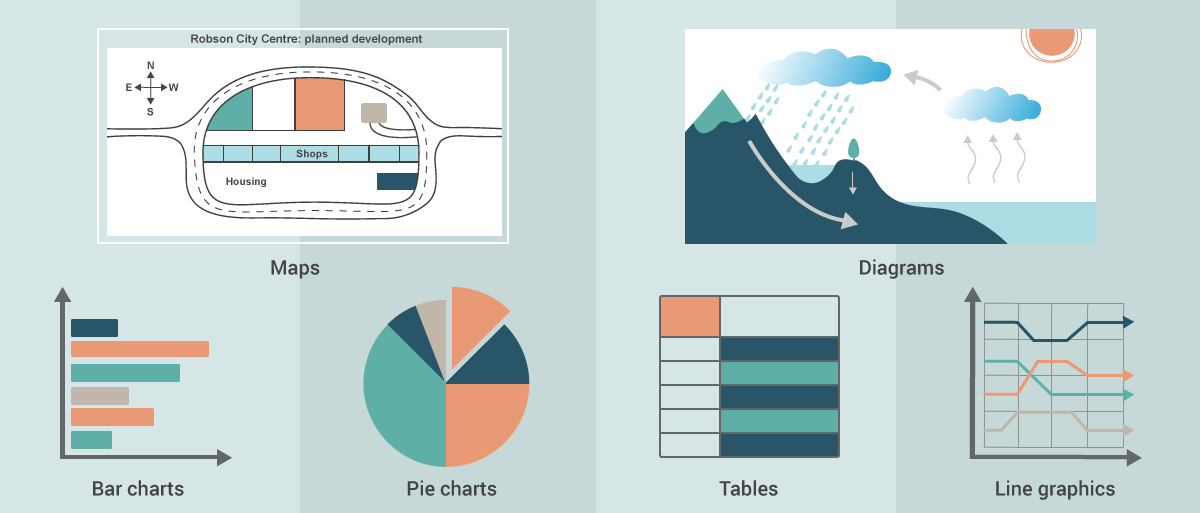
В IELTS academic writing task 1 вам подають графік, таблицю, діаграму чи схему та просять описати, узагальнити чи пояснити інформацію своїми словами. Вас можуть попросити описати і пояснити дані, описати етапи процесу, як щось працює, або описати об'єкт чи подію.
Незалежно від того, яка візуальна інформація вам подається, ваше завдання — написати резюме візуальної інформації і описати основні тенденції, загальні відмінності, основні зміни або основні компоненти системи, або основні фази процесу. Ви маєте написати 150 слів або більше, і вам слід витратити близько 20 хвилин на цю частину тесту. Структура письма може бути такою:
- Вступ: Перефразуйте запитання
- Огляд: Опишіть загальну тенденцію або напишіть загальний огляд основних угруповань
- Основний абзац 1: Напишіть детально про перше угруповання логічно
- Основний абзац 2: Напишіть детально про друге угруповання логічно
Тож кроки для написання звіту за цим завданням дуже прості:
- Проаналізуйте діаграму(и) і сплануйте, як згрупувати інформацію
- Напишіть есе, використовуючи рекомендовану структуру есе
- Вичитайте есе
Розгляньмо кожен можливий тип візуальних графіків, таблиць, діаграм та схем, з якими ви можете зіткнутися у вашому тесті IELTS writing:
Лінійні графіки
У цьому типі завдання вам дадуть один чи кілька лінійних графіків. Кожен лінійний графік матиме 1-8 ліній, що показують, як значення змінюються з часом. Період часу може бути минулим, теперішнім або майбутнім, чи поєднанням усіх трьох. Ваше завдання — написати резюме, охопивши найважливіші моменти і підкріплюючи свій опис включенням даних.
The chart illustrates average CO2 emissions per person in four European countries between 1975 and 2015.
Summarise the information by selecting and reporting the main features, and make comparisons where relevant.
- Write at least 150 words.
- You should spend around 20 minutes on this task.
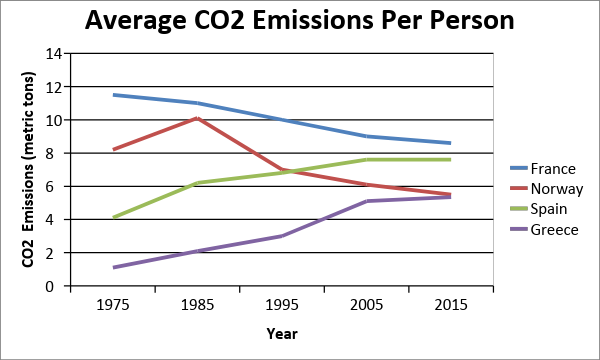
The line graph depicts the average Carbon dioxide emission for each individual residing in four countries, namely France, Norway, Spain, and Greece, over 40 years.
Overall, although CO2 production in France and Norway declined, it increased significantly in Spain and Greece over the period. Norway improved the most to become the most environmentally friendly, whereas Greece had the highest increase of all in that time.
Throughout the period, France produced the most CO2, though production declined overall from 11 tonnes per individual in 1975 to around 8.5 tonnes by 2015. In turn, except for a spike in emissions in 1985, Norway’s production of CO2 fell from 8 to under 6 tonnes forty years later.
On the contrary, CO2 release in Spain and Greece saw a more upward turn. In Spain, production doubled from 4 tonnes in 1975, overtaking Norway by 1995, to a final figure of just under 8 metric tonnes per head of population. Similarly, emissions in Greece, which were the lowest in 1975, increased five times to equal those of Norway in 2015.

Line Chart
Learn how to answer this question in a step-by-step interactive exercise
Line Chart
У завданні IELTS Academic Task 1 ви описуєте, що показує графік. Ви не висловлюєте власної думки й не пояснюєте, чому числа саме такі.
Лінійний графік показує, як значення змінюються в часі, часто для кількох ліній одночасно, тому цей звіт описує зміни й порівнює лінії.
Перегляньте завдання, потім натисніть «Далі», щоб продовжити.
Перегляньте запитання
Summarise the information by selecting and reporting the main features, and make comparisons where relevant.
Write at least 150 words.
Прочитайте графік, перш ніж писати. Перевірте назву, часовий період на горизонтальній осі, одиниці виміру на вертикальній осі та легенду, яка називає кожну лінію.
Потім знайдіть точку, де закінчуються виміряні дані й починається прогноз. Ця точка розділяє часи дієслів: форми минулого часу для років, які вже виміряно, і форми на кшталт is expected to, is predicted to та is set to для років, які ще попереду.
Дайте відповіді на запитання про графік.
Прочитайте діаграму
У вступі ви своїми словами пояснюєте, що показує графік. Перефразуйте завдання: змініть формулювання, збережіть зміст, а також тему, те, що вимірюють лінії, і часовий період.
За скопійоване речення завдання бали не нараховуються, і числам тут не місце. Залиште всі числа для основних абзаців.
Напишіть одне-два речення, які перефразовують завдання.
Напишіть вступ
Запитання завдання
The chart illustrates average CO2 emissions per person in four European countries between 1975 and 2015.
Summarise the information by selecting and reporting the main features, and make comparisons where relevant.
Write at least 150 words.
Звіт Task 1 потребує одного основного абзацу для кожної групи ліній, а на лінійному графіку ліній зазвичай більше, ніж груп. Об’єднуйте лінії, що рухаються в тому самому напрямку: лінії, що зростають, лінії, що спадають, і лінії, що залишаються на одному рівні. Якщо всі лінії рухаються однаково, буде один абзац; якщо є по одній лінії кожного типу, буде три.
Окремий абзац для кожної лінії або для кожної половини періоду руйнує порівняння, якого вимагає завдання. Групування лише за рівнем може об’єднати в одному абзаці лінію, що зростає, і лінію, що спадає.
Виберіть групування, яке дає кожному абзацу одну чітку закономірність.
Створіть групи
Виберіть групування, яке дає кожному абзацу одну чітку закономірність.
- Group 1: Norway, Spain, Greece. Group 2: France.
- Group 1: Greece. Group 2: France, Norway, Spain.
- Group 1: Norway, Greece. Group 2: France, Spain.
- Group 1: France, Norway. Group 2: Spain, Greece.
Загальний огляд описує найбільшу закономірність на всьому графіку. Його складають головні особливості. Спочатку: який загальний напрямок кожної групи протягом періоду? Потім: якщо груп дві або більше, наскільки далеко одна від одної тримаються перша й остання групи і чи ця різниця збільшується, зменшується, чи групи міняються місцями?
Поєднайте ці особливості, і загальний огляд готовий. Не додавайте сюди окремих років чи чисел. Залиште їх для основних абзаців.
Знайдіть головні особливості, щоб побудувати загальний огляд.
Знайдіть загальну тенденцію
Тепер перетворіть дві головні особливості на одне-два речення. Саме загальний огляд екзаменатор шукає у звіті насамперед, тож напишіть його перед будь-якими деталями й зробіть загальним.
Узгодьте час дієслів із графіком і описуйте, що показує графік, а не чому. Не наводьте чисел і не додавайте власної думки.
Напишіть одне-два загальні речення про найбільшу закономірність.
Напишіть загальний огляд
Основний абзац 1 стосується лише вашої першої групи ліній протягом усього періоду, і саме тут місце для чисел.
Описуйте форму кожної лінії, а не кожну її точку: початкове значення, напрямок, будь-яку зміну напрямку та кінцеве або прогнозоване значення. Використовуйте мову змін у часі, як-от rise steadily, fluctuate, level off і peak, і вказуйте рік біля кожного числа.
Якщо не знаєте, як сформулювати пункт, натисніть на нього, і до вашого поля для письма додасться зразок речення.
Напишіть три-чотири речення з числами про свою першу групу.
Напишіть основний абзац 1
Основний абзац 2 стосується лише вашої другої групи ліній. Опрацюйте її так само: форма кожної лінії, підкріплена числами.
Не повторюйте основний абзац 1. Пов’язуйте групи там, де варто назвати різницю, за допомогою фраз на кшталт in contrast і far lower than.
Якщо не знаєте, як сформулювати пункт, натисніть на нього, і до вашого поля для письма додасться зразок речення.
Напишіть три-чотири речення з числами про свою другу групу.
Напишіть основний абзац 2
План вашого звіту готовий. Завершена відповідь Task 1 складається з таких частин у такому порядку: вступ, що перефразовує завдання, загальний огляд найбільшої закономірності та по одному основному абзацу на кожну групу, який підтверджує цю закономірність вибраними числами.
Прочитайте всі частини разом і перевірте три речі: загальний огляд і деталі узгоджуються, час дієслів відповідає виміряним і прогнозованим значенням, а кожне число має одиницю виміру й рік.
Перегляньте план звіту, а потім порівняйте його зі зразковим есе.
Повний план звіту
Як вирішити
Лінійний графік в IELTS Academic Task 1 показує, як значення змінюються з часом, часто для кількох ліній одночасно. Ви описуєте ці зміни й порівнюєте лінії. Вам не потрібна кожна точка на кожній лінії.
Дотримуйтеся сталого порядку дій, щоб звіт був спланований ще до того, як ви напишете перше речення.
- Прочитайте діаграму. Перевірте назву, часовий період, одиниці виміру, легенду і те, де закінчуються виміряні дані й починається прогноз, якщо він є.
- Напишіть вступ. Перефразуйте завдання й назвіть, що показує графік.
- Створіть групи. Об’єднайте в групи лінії, які поводяться схоже, щоб кожен основний абзац мав одну чітку думку.
- Знайдіть загальну тенденцію. Визначте найважливішу закономірність на всьому графіку, перш ніж розглядати окремі значення.
- Пишіть звіт поетапно. Спершу напишіть загальний огляд, потім по одному основному абзацу на кожну групу з вибраними цифрами, а потім перегляньте весь план.
Згрупуйте лінії, перш ніж їх описувати. Графік із багатьма лініями перетворюється на короткий звіт, коли схожі лінії описано в одному абзаці, і саме групування завдання має на увазі під вибором головних особливостей.
Прочитайте графік
Почніть з осей. Горизонтальна вісь показує часовий період, вертикальна вісь показує одиниці виміру, а легенда називає кожну лінію. Знайдіть точку, де закінчуються виміряні дані, бо все, що після неї, є прогнозом і потребує форм майбутнього часу.
Вступ
Вступ складається з одного або двох речень, які іншими словами, ніж у завданні, передають, що показує графік. Збережіть тему, те, що вимірюють лінії, і часовий період. Не наводьте цифр і тенденцій.
Групи
Звіт Task 1 має по одному основному абзацу на кожну групу ліній. Об’єднайте в групи лінії, що рухаються в одному напрямку: ті, що зростають, ті, що спадають, і ті, що залишаються стабільними. Якщо всі лінії рухаються однаково, виходить один абзац; якщо є по одній лінії кожного типу, виходить три.
Загальна тенденція
Загальна тенденція є найважливішою закономірністю на графіку: загальний напрямок кожної групи за період і те, наскільки далеко одна від одної залишаються групи. Це загальне твердження, тож у ньому немає цифр.
Щоб навчитися справлятися з лінійними графіками IELTS Academic Writing Task 1, ознайомтеся з нашим уроком IELTS Academic Writing Task - Line Graphs.
7-денна безкоштовна пробна версіяСтовпчасті діаграми
У цьому типі завдання вам дадуть одну чи кілька стовпчастих діаграм. Стовпчасті діаграми можуть показувати як значення змінюються з часом (динамічні дані), різниці між значеннями в один момент часу (статичні дані) або результати опитування чи анкетування. Інформація може бути про ситуацію в минулому, теперішньому або майбутньому, чи поєднанні всіх трьох. Ваше завдання — написати резюме, охопивши найважливіші моменти і підкріплюючи свій опис включенням даних.
The chart below shows the proportion of males and females in Malaysia who commonly do physical activity in 2010.
Summarise the information by selecting and reporting the main features, and make comparisons where necessary.
- Write at least 150 words.
- You should spend around 20 minutes on this task.
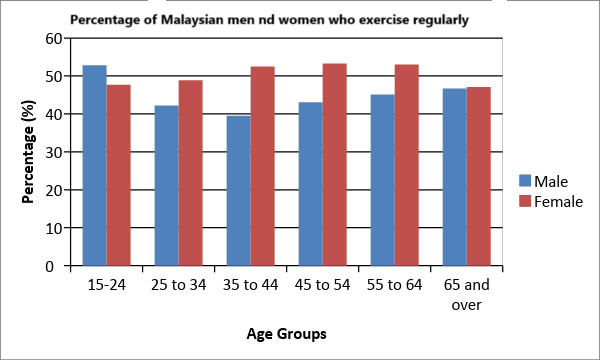
The bar chart compares the proportion of male and females of differing age groups who frequently undertook physical activity in 2010.
Overall, while the Malaysian population keeps fit in general, a higher proportion of women than men exercised in 2010, with some further differences between age groups. Middle-aged females were the most likely to work out, while for men, those aged 15 to 24 tended to do the most physical activity.
In terms of men’s exercise habits, younger men were much more likely to exercise than older men with 52.8% of those aged under 24 exercising as opposed to only around 40% of older age groups
By contrast, around half of all women in all age groups reported keeping fit, especially those aged between 35 and 64 at around 53%. The exception was the youngest age group in which only 47.7 percent of women exercised compared to 52.8% of men. Similarly, for people 65 and over, just approximately 47% of both sexes were recorded regularly working out.
Bar Chart
Learn how to answer this question in a step-by-step interactive exercise
Bar Chart
У завданні IELTS Academic Task 1 ви описуєте, що показує діаграма. Ви не висловлюєте власної думки й не пояснюєте, чому числа саме такі.
Стовпчикова діаграма порівнює групи за низкою категорій, тому цей звіт будується на порівняннях, а не на змінах у часі.
Перегляньте завдання, потім натисніть «Далі», щоб продовжити.
Перегляньте запитання
Summarise the information by selecting and reporting the main features, and make comparisons where necessary.
Write at least 150 words
Прочитайте діаграму, перш ніж писати. Перевірте назву, категорії на горизонтальній осі, одиниці виміру на вертикальній осі та легенду, яка називає кожну групу стовпчиків.
Одиниці виміру визначають ваші формулювання. Кількість людей, відсотки та суми грошей не одне й те саме, і неправильно названа одиниця коштує балів, навіть якщо решта речення правильна.
Дайте відповіді на запитання про діаграму.
Прочитайте діаграму
У вступі ви своїми словами пояснюєте, що показує діаграма. Перефразуйте завдання: змініть формулювання, збережіть зміст, а також тему, групи, які порівнюються, і місце чи час, якщо їх указано в завданні.
За скопійоване речення завдання бали не нараховуються, і числам тут не місце. Залиште всі числа для основних абзаців.
Напишіть одне-два речення, які перефразовують завдання.
Напишіть вступ
Запитання завдання
The chart below shows the proportion of males and females in Malaysia who commonly do physical activity in 2010.
Summarise the information by selecting and reporting the main features, and make comparisons where necessary.
Write at least 150 words
Звіт Task 1 потребує одного основного абзацу для кожної групи, тож заздалегідь вирішіть, як ви розділите дані. Об’єднуйте ряди даних із легенди, які поводяться подібно: ряди, що мають схожий рівень або що вищі й нижчі в тих самих категоріях, ідуть в один абзац. Ряди, які поводяться інакше, отримують власний абзац. Тоді в кожному абзаці буде одна чітка думка.
Якщо лише відокремити високі значення від низьких або дати кожній категорії власний абзац, вам доведеться повторюватися.
Виберіть групування, яке дає кожному абзацу одну чітку думку.
Створіть групи
Виберіть групування, яке дає кожному абзацу одну чітку думку.
- Group 1: Female. Group 2: Male.
- One group: Male and Female.
Загальний огляд описує найбільшу закономірність на всій діаграмі. Його складають до трьох головних особливостей. Яка група вища в більшості категорій? Яка група найнижча в більшості категорій? Чи різниця приблизно однакова в усіх категоріях, чи одна категорія дуже відрізняється від інших?
Не на кожній діаграмі є всі три, тому на цьому кроці запитують лише про ті особливості, які важливі для цієї діаграми. Поєднайте їх, і загальний огляд готовий. Не додавайте сюди окремих чисел. Залиште їх для основних абзаців.
Знайдіть головні особливості, щоб побудувати загальний огляд.
Знайдіть загальну тенденцію
Тепер перетворіть знайдені головні особливості на одне-два речення. Саме загальний огляд екзаменатор шукає у звіті насамперед, тож напишіть його перед будь-якими деталями й зробіть загальним.
Описуйте, що показує діаграма, а не чому вона так виглядає. Не наводьте чисел і не додавайте власної думки.
Напишіть одне-два загальні речення про найбільшу закономірність.
Напишіть загальний огляд
Основний абзац 1 стосується лише вашої першої групи, і саме тут місце для чисел.
Виберіть важливі порівняння: найвище значення, найнижче значення та будь-яку категорію, що поводиться не так, як решта. Оскільки стовпчикова діаграма порівнює групи в той самий період, використовуйте мову порівняння, як-от higher than, twice as many as і the largest of all the categories.
Якщо не знаєте, як сформулювати пункт, натисніть на нього, і до вашого поля для письма додасться зразок речення.
Напишіть три-чотири речення з числами про свою першу групу.
Напишіть основний абзац 1
Основний абзац 2 стосується лише вашої другої групи. Опрацюйте її так само, як першу: найчіткіші порівняння, підкріплені числами.
Не повторюйте основний абзац 1. Пов’язуйте групи там, де варто назвати різницю, за допомогою фраз на кшталт in contrast і compared with.
Якщо не знаєте, як сформулювати пункт, натисніть на нього, і до вашого поля для письма додасться зразок речення.
Напишіть три-чотири речення з числами про свою другу групу.
Напишіть основний абзац 2
План вашого звіту готовий. Завершена відповідь Task 1 складається з таких частин у такому порядку: вступ, що перефразовує завдання, загальний огляд найбільшої закономірності та по одному основному абзацу на кожну групу, який підтверджує цю закономірність вибраними числами.
Прочитайте всі частини разом і перевірте три речі: загальний огляд і деталі узгоджуються, кожне число має одиницю виміру, і ви описали діаграму, не пояснюючи її.
Перегляньте план звіту, а потім порівняйте його зі зразковим есе.
Повний план звіту
Як вирішити
Стовпчикова діаграма в IELTS Academic Task 1 вимагає описати, що вона показує, і порівняти групи на ній. Вам не потрібні всі числа. Вам потрібні важливі порівняння.
Дотримуйтеся сталого порядку дій, щоб звіт був спланований ще до того, як ви напишете перше речення.
- Прочитайте діаграму. Перевірте назву, категорії, одиниці виміру й легенду, перш ніж щось писати.
- Напишіть вступ. Перефразуйте завдання й назвіть, що показує діаграма.
- Створіть групи. Розподіліть дані так, щоб кожен основний абзац мав одну чітку думку.
- Знайдіть загальну тенденцію. Визначте найважливішу закономірність на всій діаграмі, перш ніж розглядати окремі значення.
- Пишіть звіт поетапно. Спершу напишіть загальний огляд, потім по одному основному абзацу на кожну групу з вибраними цифрами, а потім перегляньте весь план.
Чіткий загальний огляд вартий більше, ніж додаткові числа. Завдання вимагає вибрати головні особливості, тож загальне твердження і кілька влучних порівнянь отримають вищу оцінку, ніж перелік усіх значень.
Прочитайте діаграму
Почніть з осей. Горизонтальна вісь називає те, що порівнюється, вертикальна вісь показує одиниці виміру, а легенда називає кожну групу стовпчиків. Якщо у звіті вказано не ту одиницю виміру, змінюється зміст кожного речення в ньому.
Вступ
Вступ складається з одного або двох речень, які іншими словами, ніж у завданні, передають, що показує діаграма. Збережіть тему, групи, які порівнюються, і місце або час. Не наводьте цифр і тенденцій.
Групи
Звіт Task 1 має по одному основному абзацу на кожну групу. Об’єднайте в групи ряди з легенди, які поводяться схоже: ряди на подібному рівні або ряди, які вищі й нижчі в тих самих категоріях. Тоді кожен абзац містить одну думку, і ви ніколи не повторюєтеся.
Загальна тенденція
Загальна тенденція є найважливішою закономірністю на діаграмі: яка група вища в більшості категорій, яка група найнижча в більшості категорій і чи розрив приблизно однаковий у кожній категорії, чи одна категорія сильно відрізняється. Діаграма може показувати одне, два або всі три. Це загальне твердження, тож у ньому немає цифр.
Стовпчасті діаграми досить поширені в IELTS writing task 1 academic. Існує три різні сценарії, з якими ви зіткнетеся у завданні зі стовпчастою діаграмою:
- Стовпчаста діаграма з категоріями на осі x
- Стовпчаста діаграма з датами або роками на осі (функціонує як лінійний графік)
- Подано дві стовпчасті діаграми
Кожен сценарій вимагає написання звіту по-різному. Зареєструйтеся на 7-денну безкоштовну пробну версію для доступу до таких уроків зі стовпчастих діаграм:
- IELTS Academic Writing Task - Bar Charts Part 1 урок.
- IELTS Academic Writing Task - Bar Charts Part 2 урок.
- IELTS Academic Writing Task - Bar Charts Part 3 урок.
Кругові діаграми
У цьому типі завдання вам дадуть одну, дві або три кругові діаграми. Кругові діаграми можуть показувати відсотки від загальної цифри. Якщо у вас одна кругова діаграма, вона представлятиме один момент часу (статичні дані). Якщо у вас дві або більше кругові діаграми, вони можуть представляти як відсотки змінюються з часом або порівнювати різні країни чи групи. Ваше завдання — написати резюме, охопивши найважливіші моменти і підкріплюючи свій опис включенням даних.
The charts below show the percentage of water used for different purposes in six areas of the world. Summarise the information by selecting and reporting the main features, and make comparisons where relevant.
- Write at least 150 words.
- You should spend around 20 minutes on this task.
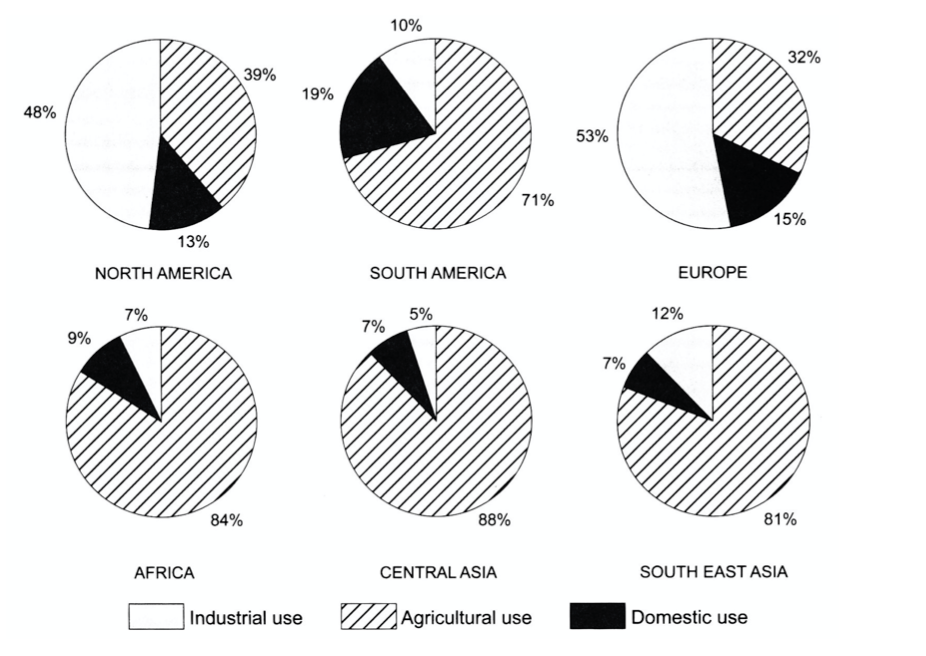
The pie charts provide information regarding the proportions of water used for industrial, agriculture, and domestic use in six regions.
In general, water serves mostly an industrial purpose in North America and Europe, whereas it is predominantly used for agriculture in South America, Africa, Central Asia, and South-East Asia.
Regarding industrial and domestic use, North America and Europe consume an average of approximately 50 percent of water for industrial purposes. However, these two regions report much less water consumption for domestic purposes, utilizing 13 percent and 15 percent, respectively. Out of all six regions, South America dedicates the highest percentage of water consumption for domestic use, but uses only 10 percent for industrial reasons. Both industrial and domestic use remain the least popular choices in Africa, Central Asia, and South-East Asia, where their combined use makes up less than 20 percent of the overall water consumption in each of the three regions.
Agricultural use, on the other hand, accounts for 71 percent of water consumption in South America and over three-fourths of water use in Africa, South-East Asia, and Central Asia, where it is nearly 90 percent. North America and Europe consume less than 40 percent of water for agricultural purposes.
Щоб навчитися справлятися з круговими діаграмами IELTS Academic Writing Task 1, зареєструйтеся на 7-денну безкоштовну пробну версію для доступу до уроку IELTS Academic Writing Task - Pie Charts.
7-денна безкоштовна пробна версіяТаблиці
У цьому типі завдання вам дається таблиця, що містить дані. Може показувати динамічні цифри, які змінюються з часом, або статичні дані на один момент часу. Часто інформації забагато, тож ви не зможете включити кожну деталь. Ваше завдання — написати резюме, охопивши найважливіші моменти і підкріплюючи свій опис включенням даних.
The table below gives the average time spent and distance traveled by UK commuters in one year. Time and distance are given in minutes and miles accordingly.
Summarise the information by selecting and reporting the main features, and make comparisons where relevant.
Commuting Habits of different regions of the UK in a year
UK Region | Average Commuting Time (minutes) | Average Commuting Distance (miles) |
London | 54 | 14 |
South East | 78 | 20 |
Scotland | 45 | 19 |
West Midlands | 39 | 18 |
North West | 36 | 18 |
Northern Ireland | 36 | 15 |
Yorkshire & Humberside | 36 | 14 |
South West | 34 | 16 |
East Anglia | 33 | 15 |
North East | 32 | 19 |
East Midlands | 32 | 15 |
Wales | 27 | 14 |
- Write at least 150 words.
- You should spend around 20 minutes on this task.
The table shows data on the average commuting time (minutes) and distance (miles) completed by UK citizens in 12 different regions in one year.
Overall, with the exception of London, the further people travel, the more time they need to reach work people. Commuters in the south east region spend the longest time commuting over the greatest distance, whereas people in Wales spend the least.
Regarding the top three UK regions, on average, people in the south east travel both the farthest and longest at 20 miles over 78 minutes. Likewise inhabitants of Scotland journey a similar distance to work, yet spend almost half the time doing so at 45 minutes to get there, while those living in London spend the second-longest time travelling (54 minutes) over just 14 miles.
Of the other regions, people in the West Midlands spent the most time travelling at 39 minutes whereas those in Wales recorded the lowest time at 27 minutes. With regard to distance, residents of the North East, West Midlands and North West recorded the greatest mileage at 19, 18 and 18 miles respectively, while people in Yorkshire and Humberside as well as Wales both travelled the shortest distance to work of all at 14 miles.
Щоб навчитися справлятися з таблицями IELTS Academic Writing Task 1, зареєструйтеся на 7-денну безкоштовну пробну версію для доступу до таких уроків:
- IELTS Academic Writing Task - Tables Part 1 урок.
- IELTS Academic Writing Task - Tables Part 2 урок.
Схеми процесів
Для цього типу запитання вам дадуть схему, яка показує, як щось працює.
Схема може показувати машину, систему або природне явище.
Часто даних немає або їх мало.
Ваше завдання — узагальнити інформацію, показану на схемі.
The diagram below shows the water cycle, which is the continuous movement of water on, above and below the surface of the Earth.
Summarise the information by selecting and reporting the main features.
- Write at least 150 words.
- You should spend around 20 minutes on this task.
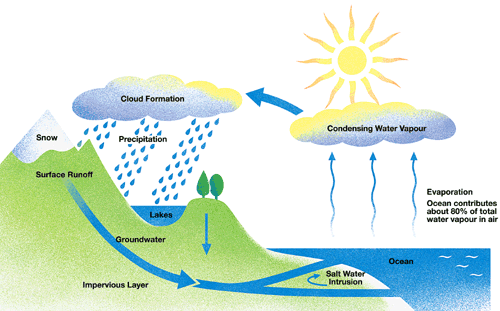
The diagram illustrates the hydrological cycle by which water moves through our natural environment. Overall, there are several stages to the process involving evaporation, precipitation and the final return of water to the ocean where the process begins over.
Since 80% of all water begins in the ocean, most water originates from this source. Initially sea water is warmed by the sun, causing it to evaporate into the air becoming water vapor. This then rises to condense into clouds at a higher elevation, which are then then pushed by the wind over land where it condenses further and precipitation occurs, falling as either snow or rain.
After precipitation on land, water then takes one of three routes. Some of it may fall into lakes or return to the ocean as surface runoff. Still further water percolates underground to an impermeable layer where it again flows back to the sea. Salt water also intrudes from the ocean into the land in coastal areas.

Process Diagram
Learn how to answer this question in a step-by-step interactive exercise
Process Diagram
Завдання IELTS Academic Task 1 зі схемою процесу показує крок за кроком, як щось виготовляють або як працює певна система. Ви описуєте етапи в тому порядку, у якому їх показано на схемі, і не наводите причин чи власних думок.
Перегляньте запитання завдання, потім натисніть «Далі», щоб продовжити.
Перегляньте запитання
Summarise the information by selecting and reporting the main features.
Write at least 150 words.
Перш ніж щось писати, переконайтеся, що ви розумієте схему. Порахуйте кроки й простежте за стрілками, щоб побачити, де процес починається і де він закінчується. Якщо остання стрілка повертається до першого етапу, процес є циклом і кінцевого продукту немає.
Дайте відповіді на запитання про схему.
Прочитайте діаграму
Вступ повідомляє читачеві, що показує схема. Перефразуйте запитання завдання своїми словами, а не копіюйте його, і назвіть процес. Не описуйте тут жодного з кроків.
Напишіть одне або два речення для вступу.
Напишіть вступ
Запитання завдання
The diagram below shows the water cycle, which is the continuous movement of water on, above and below the surface of the Earth.
Summarise the information by selecting and reporting the main features.
Write at least 150 words.
Звіт IELTS Task 1 потребує одного основного абзацу для кожної групи етапів. Не пишіть окремий абзац для кожного кроку. Розділіть процес у його природних точках, там, де змінюється місце, матеріал або мета, щоб кожна група була низкою етапів, які йдуть один за одним. Більшість процесів дає дві групи; короткий процес може дати одну, а довгий три.
Виберіть групи.
Створіть групи
Виберіть групи.
- Group 1: stages 1 to 2 (Evaporation to Condensing Water Vapour). Group 2: stages 3 to 4 (Cloud Formation to Precipitation). Group 3: stages 5 to 6 (Surface Runoff to Groundwater).
- Group 1: stages 1 to 3 (Evaporation to Cloud Formation). Group 2: stages 4 to 5 (Precipitation to Surface Runoff). Group 3: stage 6 (Groundwater).
- Group 1: stages 1 to 3 (Evaporation to Cloud Formation). Group 2: stages 4 to 6 (Precipitation to Groundwater).
- Group 1: stages 1 to 2 (Evaporation to Condensing Water Vapour). Group 2: stages 3 to 5 (Cloud Formation to Surface Runoff). Group 3: stage 6 (Groundwater).
Загальний огляд підсумовує весь процес одним поглядом. Запитайте себе, скільки кроків має процес і які основні етапи він проходить від початку до кінця. Процес рідко порівнюють із чимось іншим, тому опишіть загальний хід процесу, а не шукайте зростання чи спаду.
Дайте відповіді на запитання, щоб знайти загальну тенденцію.
Знайдіть загальну тенденцію
Скористайтеся нотатками з попереднього кроку. Загальний огляд називає кількість кроків і основні етапи та повідомляє, чи завершується процес продуктом, чи повторюється як цикл. Обладнання, час і температуру залиште для основних абзаців і не наводьте причин чи власних думок.
Напишіть одне або два речення для загального огляду.
Напишіть загальний огляд
Основний абзац 1 описує першу групу етапів крок за кроком, у порядку, який показують стрілки. Використовуйте пасивні форми, як-от is heated, is mixed і is poured, бо схема рідко вказує, хто виконує роботу. Поєднуйте кроки словами послідовності, як-от first, then і after that.
Напишіть три або чотири речення для основного абзацу 1.
Напишіть основний абзац 1
Основний абзац 2 описує вашу другу групу етапів. Він продовжує з того місця, де зупинився основний абзац 1, тож послідовність ніде не переривається. Далі використовуйте пасивні форми й пов’язуйте групи такими фразами, як once і after this. Якщо це останній абзац, позначте кінець словами in the final stage або finally, а якщо процес є циклом, скажіть, що останній крок веде назад до першого.
Напишіть три або чотири речення для основного абзацу 2.
Напишіть основний абзац 2
Ваші частини тепер складають один звіт: вступ, загальний огляд і по одному основному абзацу для кожної групи етапів. Прочитайте їх разом і перевірте, що етапи досі йдуть по порядку, що пасивні форми правильні і що звіт достатньо довгий.
Прочитайте повний план свого звіту, потім натисніть «Далі», щоб порівняти його зі зразковим звітом.
Повний план звіту
Як вирішити
Завдання зі схемою процесу показує, як щось виготовляють або як працює певна система, крок за кроком. Схема має сталий порядок, тож звіт іде за цим порядком від першого етапу до останнього.
Дотримуйтеся сталого порядку дій, щоб етапи йшли послідовно і жоден крок не загубився.
- Прочитайте діаграму. Порахуйте кроки й пройдіть за стрілками, щоб побачити, де процес починається і де закінчується.
- Напишіть вступ. Перефразуйте запитання завдання й назвіть процес, без жодних деталей.
- Створіть групи. Розділіть етапи на групи в природних точках процесу, по одному основному абзацу на кожну групу.
- Знайдіть загальну тенденцію. Визначте, скільки є кроків і які головні етапи від початку до кінця.
- Напишіть загальний огляд і основні абзаци. Спершу коротко опишіть загальну форму процесу, потім опишіть кроки по черзі.
- Повний план звіту. Прочитайте всі свої частини разом і порівняйте їх зі зразковим звітом.
Звіт про процес пишуть у пасивному стані. Схема рідко показує, хто виконує роботу, тож використовуйте форми на кшталт «is heated», «is mixed» і «is stored» і з’єднуйте кроки словами послідовності, як-от «first», «after that» і «finally».
Прочитайте
Схема процесу показує етапи, з’єднані стрілками. Порахуйте кроки й пройдіть за стрілками, щоб перевірити, де процес починається і де закінчується. Якщо остання стрілка повертається до першого етапу, процес є циклом і кінцевого продукту немає.
Вступ
Вступ повідомляє, що показує схема. Перефразуйте запитання завдання своїми словами, а не копіюйте його, і назвіть процес. Не описуйте в цих реченнях окремих кроків.
Групи
Звіт Task 1 потребує по одному основному абзацу на кожну групу етапів. Не пишіть по абзацу на кожен крок. Розділіть процес у його природних точках, де змінюється місце, матеріал або мета, щоб кожна група була низкою етапів, що йдуть один за одним. Більшість процесів дають дві групи; короткий процес може дати одну, а довгий три.
Тенденція
Загальний огляд коротко підсумовує весь процес: скільки в ньому кроків і які головні етапи. Процес рідко порівнюють із чимось іншим, тож описуйте форму процесу, а не шукайте зростання чи спаду.
Напишіть
Загальний огляд іде першим і залишається загальним, без обладнання, часу чи температур. Потім кожен основний абзац описує свої кроки в тому порядку, який показують стрілки. Використовуйте пасивні форми, як-от «is heated» і «is poured», і з’єднуйте кроки словами послідовності, як-от «first», «next», «after that» і «finally».
Щоб навчитися справлятися зі схемами процесів IELTS Academic Writing Task 1, зареєструйтеся на 7-денну безкоштовну пробну версію для доступу до уроку IELTS Academic Writing Task - Process Diagrams.
7-денна безкоштовна пробна версіяКарти
Для цього типу запитання вам дадуть одну, дві або три карти.
Карти можуть показувати місто, острів або іншу географічну область.
Карти зазвичай показують зміни, які відбулися в області протягом періоду часу.
Зміни можуть бути пов'язані з будівництвом (наприклад, розвиток області для туризму)
або руйнуванням (наприклад, як область була вражена стихійним лихом, як-от землетрусом)
Ваше завдання — написати резюме змін, які мали місце, і охопити найважливіші моменти.
The maps below show the centre of a small town called Islip as it is now, and plans for its development. Summarise the information by selecting and reporting the main features, and make comparisons where relevant.
- Write at least 150 words.
- You should spend around 20 minutes on this task.
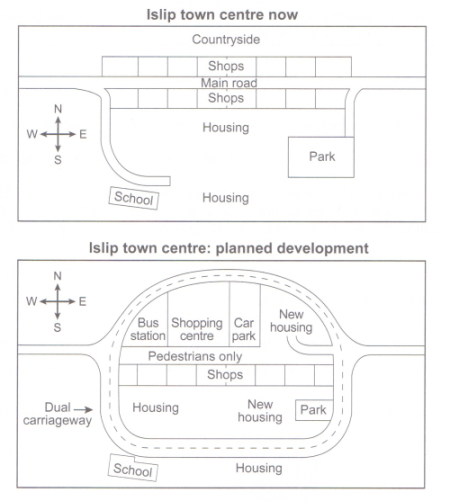
The diagrams illustrate some proposed changes to the central area of the town of Islip.
Overall, the principal change to the town will be the construction of a ring road around the centre. Various other developments with regard to shops and housing will accompany the building of this road.
As the first map reveals, lslip town center now is relatively small. There is a main road from the west to the east with shops on both sides. The northern area is rarely countryside, while the southern area is filled with houses with a school at the end of the fork road in the southwest corner and a park in the southeast area.
In the future, the main road is expected to reform into a dual carriageway as a round containing all the new buildings. The shops along the north side of the new pedestrian street will be demolished to make way for a bus station, shopping centre, car parks and new housing area. The shops along the south side of the street will remain, but it seems that the town's park will be reduced in size so that more new houses can be built within the ring road.
Map
Learn how to answer this question in a step-by-step interactive exercise
Map
Завдання IELTS Academic Task 1 з картою дає вам два або більше планів того самого місця в різні моменти часу, найчастіше два. Ви пишете звіт щонайменше на 150 слів, у якому описуєте, як змінилося місце, і не висловлюєте думок та не наводите причин.
Перегляньте завдання, потім натисніть «Далі», щоб продовжити.
Перегляньте запитання
Write at least 150 words.
Почніть із читання карт, а не з письма. Перевірте, яке місце показано, які моменти часу порівнюються і скільки у вас карт. Потім знайдіть, що з’явилося, що зникло і що тепер використовується для чогось іншого.
Дайте відповіді на запитання про карти.
Прочитайте діаграму
Вступ своїми словами перефразовує завдання. Назвіть, що показують карти і який період вони охоплюють, і змініть формулювання завдання замість того, щоб його копіювати. Деталі, мова розташування й дієслова змін будуть пізніше.
Напишіть одне-два речення, які перефразовують завдання.
Напишіть вступ
Запитання завдання
The maps below show the centre of a small town called Islip as it is now, and plans for its development. Summarise the information by selecting and reporting the main features, and make comparisons where relevant.
Write at least 150 words.
Звіт Task 1 потребує одного основного абзацу для кожної групи карт. Зазвичай кожна карта є окремою групою: раніша карта в першому абзаці, пізніша в другому, бо так моменти часу не змішуються. Дві карти, які найкраще описувати разом, можуть утворити одну групу, а три карти зазвичай дають три абзаци.
Окремий абзац для кожного об’єкта або для кожної половини карти руйнує порівняння між моментами часу.
Виберіть групування, яке дає чіткі основні абзаци.
Створіть групи
Виберіть групування, яке дає чіткі основні абзаци.
- One group: now and planned development.
- Group 1: now. Group 2: planned development.
Загальний огляд називає найбільшу зміну за весь період. Запитайте себе, чи місце розрослося, чи зменшилося, і які види використання землі з’явилися або зникли. Окремі об’єкти й точне розташування в загальний огляд не входять.
Виберіть відповіді, які описують загальну зміну.
Знайдіть загальну тенденцію
Тепер напишіть загальний огляд своїми словами, використовуючи нотатки з попереднього кроку. Достатньо одного-двох речень. Опишіть загальний розвиток місця й не згадуйте точного розташування, окремих об’єктів і причин зміни.
Напишіть загальний огляд в одному-двох реченнях.
Напишіть загальний огляд
Перший основний абзац детально описує карту або карти вашої першої групи. Використовуйте форми минулого часу для стану, якого вже немає, і мову розташування, як-от «to the north of», «beside» і «on the edge of», щоб читач міг уявити, де розміщений кожен об’єкт. Описуйте об’єкти, а не причини.
Напишіть три-чотири речення для основного абзацу 1.
Напишіть основний абзац 1
Другий основний абзац описує карту або карти вашої другої групи та зміни порівняно з ранішою картою. Використовуйте пасивні форми для того, що було збудовано, прибрано або замінено, як-от «was built», «had been cleared» і «has been converted», бо карти не кажуть, хто виконав роботу. Мова розташування й далі показує, де сталася кожна зміна.
Напишіть три-чотири речення для основного абзацу 2.
Напишіть основний абзац 2
Тепер ваші частини складають один звіт: вступ, загальний огляд і по одному основному абзацу на кожну групу карт. Прочитайте їх по черзі й перевірте, чи загальний огляд передає загальну картину, а основні абзаци містять деталі.
Прочитайте план звіту, а потім порівняйте його зі зразковим звітом.
Повний план звіту
Як вирішити
Завдання з картою дає два або більше планів того самого місця в різний час. Ви не описуєте кожну позначку. Ви розповідаєте, як місце змінилося між цими моментами часу.
Дотримуйтеся сталого порядку дій, щоб звіт подавав загальну картину раніше, ніж деталі.
- Прочитайте діаграму. Перевірте місце, моменти часу та головні об’єкти на кожній карті, перш ніж планувати.
- Створіть групи. Розподіліть інформацію на групи карт, по одному основному абзацу на кожну, зазвичай спершу раніша карта, потім пізніша.
- Знайдіть загальну тенденцію. Визначте найбільшу зміну за весь період, як-от зростання, занепад або нове використання землі.
- Пишіть звіт поетапно. Напишіть вступ, потім загальний огляд, потім по одному основному абзацу на кожну групу.
- Повний план звіту. Прочитайте всі частини разом і порівняйте їх зі зразковим звітом.
Звіт про карти тримається на мові розташування та пасивних формах. Фрази на кшталт «to the north of» і «beside the river» вказують місце кожного об’єкта, а форми на кшталт «was built» чи «had been removed» повідомляють про зміну, не називаючи, хто її виконав.
Прочитайте
Перш ніж планувати, перевірте, що показують карти: місце, моменти часу та головні об’єкти на кожній карті. Потім знайдіть, що з’явилося, що зникло і що тепер використовується для іншого. Цей етап читання не дасть вам описати лише одну з карт.
Групи
Звіт IELTS Task 1 потребує по одному основному абзацу на кожну групу карт. Зазвичай кожна карта є окремою групою: спершу раніша карта, потім пізніша. Дві карти, які найкраще описати разом, можуть утворити одну групу, а три карти зазвичай дають три абзаци. Вирішіть, як розподілити карти, ще до письма, бо це визначає порядок усього звіту.
Загальний огляд
Загальний огляд називає найбільшу зміну за весь період, а не дрібну деталь. Запитайте себе, чи місце розрослося, чи зменшилося, і які види використання землі з’явилися або зникли. Окремим об’єктам і точному розташуванню місце в основних абзацах.
Напишіть
Звіт будується короткими етапами. Вступ перефразовує завдання, загальний огляд називає головну зміну, а кожен основний абзац описує одну групу. Використовуйте минулі форми для стану, який уже завершився, пасивні форми на кшталт «was built» чи «had been cleared» для змін і мову розташування, щоб показати, де стоїть кожен об’єкт.
Щоб навчитися справлятися з картами IELTS Academic Writing Task 1, зареєструйтеся на 7-денну безкоштовну пробну версію для доступу до уроку IELTS Academic Writing Task - Maps.
7-денна безкоштовна пробна версіяЗмішані дані
У цьому типі завдання вам дадуть два набори даних.
Дані будуть різних типів. Наприклад, один набір може бути зміною з часом, а другий набір — статичним.
Як альтернатива, один набір даних міг би показати відсоток, тоді як другий набір показує числа.
Вам також може бути дана ілюстрація (наприклад, схема або карта) та набір даних (наприклад, стовпчаста діаграма, лінійний графік, кругова діаграма або таблиця)
Ваше завдання — узагальнити обидва набори даних.
The pie graph depicts the main reasons for the productivity loss of agricultural land worldwide. The table shows how these causes influenced three world regions during the 2000s.
Summarise the information by selecting and reporting the main features, and make comparisons where relevant.
Causes of Land Degradation by Region (%) | ||||
Region: | Deforestation | Over-cultivation | Over-grazing | Total land degraded |
North America | 0.3 | 3.4 | 1.7 | 5.4 |
Asia | 9.8 | 7.8 | 5.7 | 23.3 |
Australia & Oceania | 1.6 | 0.3 | 11 | 12.9 |
- Write at least 150 words.
- You should spend around 20 minutes on this task.
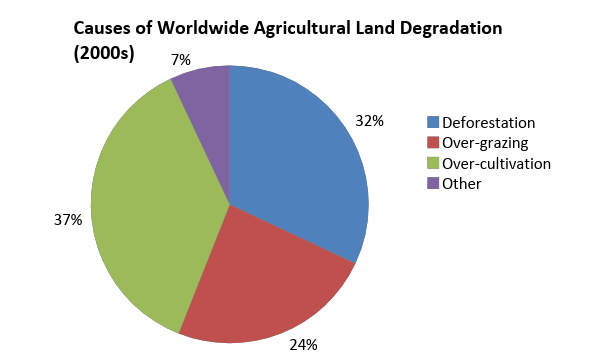
The pie chart shows the four main causes of farmland degradation in the world today, while the table presents the amount of land surface area affected by each one in three separate global regions during the 2000s.
Overall, Asia suffered more from the deterioration of farmland than other regions owing to deforestation and over-cultivation which were also the primary reasons for agricultural land loss worldwide.
Globally, 69% of degraded land is attributed to excessive cultivation and tree clearance, constituting 37% and 32% respectively. A further quarter of global land loss is due to over cultivation of crops. Other causes made up only 7% collectively.
In the 2000s, these causes affected regions of our planet differently. Asia was the worst affected where the top two causes of global land loss, deforestation and over-cultivation, resulted in 9.8% and 7.8% of degraded land there. The impact on Australia and Oceania was less severe though over-grazing was the predominant cause of land deterioration at eleven percent. The least affected of all was North America where only 5.4% of land was diminished, principally because of over-cultivation at 3.4%.
Mixed Charts
Learn how to answer this question in a step-by-step interactive exercise
Mixed Charts
Завдання IELTS Academic Task 1 з комбінованими діаграмами дає вам два або більше візуальних матеріалів різних типів на одну тему. Ви пишете звіт щонайменше на 150 слів, у якому описуєте головні особливості й пов’язуєте візуальні матеріали між собою, і не висловлюєте думок та не наводите причин.
Перегляньте завдання, потім натисніть «Далі», щоб продовжити.
Перегляньте запитання
Summarise the information by selecting and reporting the main features, and make comparisons where relevant.
Write at least 150 words.
Почніть із читання візуальних матеріалів, а не з письма. Перевірте, що показує кожен із них, і прочитайте всі підписи осей та одиниці виміру, перш ніж планувати. Візуальні матеріали різних типів часто вимірюють різні речі, тож зверніть увагу на спільне, як-от та сама група людей або той самий період.
Дайте відповіді на запитання про візуальні матеріали.
Прочитайте діаграму
Вступ своїми словами перефразовує завдання. Чітко вкажіть, що показує кожен візуальний матеріал і яку групу та період він охоплює, і змініть формулювання завдання замість того, щоб його копіювати. Числа й зв’язки між візуальними матеріалами будуть пізніше.
Напишіть одне-два речення, які перефразовують завдання.
Напишіть вступ
Запитання завдання
The pie graph depicts the main reasons for the productivity loss of agricultural land worldwide. The table shows how these causes influenced three world regions during the 2000s.
Summarise the information by selecting and reporting the main features, and make comparisons where relevant.
Write at least 150 words.
Звіт Task 1 потребує одного основного абзацу для кожної групи візуальних матеріалів, а набір комбінованих діаграм дає від однієї до трьох груп. Матеріали одного типу або однієї теми мають бути разом, бо абзац, що змішує два показники, важко зрозуміти. Дві кругові діаграми про одне й те саме ділять один абзац, а лінійний графік з іншим показником отримує власний.
Окремий абзац для кожного матеріалу може розділити те, що має бути разом, а один абзац для всіх матеріалів змішує показники. Поділ за роками або за найвищими й найнижчими числами руйнує порівняння, якого вимагає завдання.
Виберіть групування, яке дає кожному абзацу один чіткий показник.
Створіть групи
Виберіть групування, яке дає кожному абзацу один чіткий показник.
- Group 1: the pie chart. Group 2: the table.
- One group: the pie chart and the table.
Загальний огляд описує найбільшу закономірність у всіх візуальних матеріалах і йде перед будь-якими деталями. Знайдіть головний рух у кожному матеріалі, а потім вирішіть, чи один матеріал підтверджує або пояснює інший. Точні числа в загальний огляд не входять.
Виберіть відповіді, які описують головну закономірність.
Знайдіть загальну тенденцію
Тепер напишіть загальний огляд своїми словами, використовуючи нотатки з попереднього кроку. Достатньо одного-двох речень. Назвіть головну закономірність і зв’язок між візуальними матеріалами, не згадуючи точних чисел і причин цієї закономірності.
Напишіть загальний огляд в одному-двох реченнях.
Напишіть загальний огляд
Перший основний абзац детально описує першу групу. Наведіть важливі порівняння, як-от найвищу точку, найнижчу точку та найпомітнішу зміну, і підкріпіть кожне кількома вибраними числами. Не перелічуйте всі числа й не описуйте тут інші групи.
Напишіть три-чотири речення для основного абзацу 1.
Напишіть основний абзац 1
Другий основний абзац описує другу групу й пов’язує її з першою. Об’єднуйте порівняння, які стосуються одне одного, замість того щоб розбирати категорії по черзі, і використовуйте сполучну фразу, щоб показати, де візуальні матеріали узгоджуються. Описуйте, що показують дані, а не чому.
Напишіть три-чотири речення для основного абзацу 2.
Напишіть основний абзац 2
Тепер ваші частини складають один звіт: вступ, загальний огляд і по одному основному абзацу на кожну групу візуальних матеріалів. Прочитайте їх по черзі й перевірте, чи загальний огляд передає загальну картину, а основні абзаци містять деталі.
Прочитайте план звіту, а потім порівняйте його зі зразковим звітом.
Повний план звіту
Як вирішити
Завдання з комбінованими діаграмами дає два або більше візуальних матеріалів різних типів на одну тему. Ви не пишете окремий звіт для кожного з них. Ви описуєте головні особливості кожного й пов’язуєте їх там, де дані перетинаються.
Дотримуйтеся сталого порядку дій, щоб звіт подавав загальну картину раніше, ніж деталі.
- Прочитайте діаграму. Перевірте, що показує кожен візуальний матеріал, і прочитайте кожну вісь, позначку та одиницю виміру, перш ніж планувати.
- Створіть групи. Розподіліть візуальні матеріали на одну-три групи, по одному основному абзацу на кожну, зазвичай один тип діаграми або одна тема в кожній.
- Знайдіть загальну тенденцію. Визначте найважливішу закономірність у всіх візуальних матеріалах і зверніть увагу на будь-який зв’язок між ними.
- Пишіть звіт поетапно. Напишіть вступ, потім загальний огляд, потім по одному основному абзацу на кожну групу.
- Повний план звіту. Прочитайте всі частини разом і порівняйте їх зі зразковим звітом.
Групуйте важливі порівняння, а не перелічуйте всі числа. Кілька вибраних цифр, що підтверджують закономірність, дають більше балів, ніж довгий перелік, який лише повторює те, що вже показує візуальний матеріал.
Прочитайте
Візуальні матеріали різних типів вимірюють різні речі, тож спершу прочитайте кожен окремо. Перевірте назву, підписи осей, одиниці виміру й часові рамки, а потім зверніть увагу на те, що в них спільне, як-от та сама група людей або той самий період. Частка часу на круговій діаграмі й загальна кількість на лінійному графіку не є тим самим показником.
Групи
Звіт IELTS Task 1 потребує по одному основному абзацу на кожну групу візуальних матеріалів, тож їх треба розподілити на одну, дві або три групи. Візуальні матеріали одного типу або на одну тему належать разом, а матеріал, що показує інший показник, отримує окремий абзац. Вирішіть, як їх розподілити, ще до письма, бо це визначає порядок усього звіту.
Загальний огляд
Загальний огляд в одному-двох реченнях називає найважливішу закономірність у всіх візуальних матеріалах. Знайдіть головну зміну в кожному з них, а потім вирішіть, чи один матеріал підтверджує або пояснює інший. Точним цифрам і окремим категоріям місце в основних абзацах.
Напишіть
Звіт будується короткими етапами. Вступ перефразовує завдання, загальний огляд називає головну закономірність, а кожен основний абзац описує одну групу. В основних абзацах об’єднуйте порівняння, що стосуються одне одного, і підтверджуйте кожне кількома вибраними цифрами, а не перелічуйте всі числа.
Щоб навчитися справлятися зі змішаними даними IELTS Academic Writing Task 1, зареєструйтеся на 7-денну безкоштовну пробну версію для доступу до уроку IELTS Academic Writing Task - Mixed Data.
7-денна безкоштовна пробна версіяЛексика для IELTS Academic Writing Task 1
Щоб отримати високий бал за це завдання, вам потрібно навчитися використовувати відповідні слова та фрази для подання даних, поданих у круговому/стовпчастому/лінійному/змішаному графіку. Ми пропонуємо вам зареєструватися на 7-денну безкоштовну пробну версію та пройти такі уроки:
- IELTS Academic Writing Task 1 Lesson - How to write about numbers
- IELTS Academic Writing Task 1 Lesson - How to write about percentages
- IELTS Academic Writing Task 1 Lesson - How to write about changes in data
Зразки IELTS Writing Task 1
Цей розділ подає список зразків IELTS writing для IELTS Academic Writing Task 1.
- IELTS Academic Writing Task 1 - Line Chart Questions
- IELTS Academic Writing Task 1 - Bar Chart Questions
- IELTS Academic Writing Task 1 - Pie Chart Questions
- IELTS Academic Writing Task 1 - Map Questions
- IELTS Academic Writing Task 1 - Process Diagram Questions
- IELTS Academic Writing Task 1 - Mixed Data Questions
IELTS General Writing Task 1
В IELTS general training writing task 1, вам буде представлена ситуація, і вам потрібно буде написати особисту відповідь у формі неформального, напівформального або формального листа щонайменше 150 слів. Ситуації, про які вас просять написати, звичайні, повсякденні, такі як:
- написання співробітнику коледжу з проживання про проблеми з проживанням,
- написання новому роботодавцю про проблеми з управлінням часом, які у них є,
- написання у місцеву газету про план розвитку місцевого аеропорту,
- написання в орендне агентство для вирішення проблем із системою опалення в їхньому будинку.
Стосовно ситуації вам буде дано інформацію у вигляді трьох пунктів, які ви маєте включити у свою відповідь. Вам може знадобитися запитати чи надати інформацію та/або пояснити ситуацію. Щоб це зробити, вам може знадобитися зробити щось із наступного:
- попросити та/або надати загальну фактичну інформацію,
- висловити потреби, бажання, уподобання або антипатії,
- висловити думки чи скарги,
- зробити запити або внести пропозиції/рекомендації.
Стиль IELTS General Writing
Стиль письма, який ви будете використовувати, залежить від того, кому вас просять написати (тобто аудиторії) і наскільки добре ви, як передбачається, їх знаєте. Вам потрібно писати в стилі, який підходить для вашої аудиторії і який допоможе вам досягти мети вашого письма, наприклад, написання другу (неформальний) або написання менеджеру (напівформальний або формальний). Вам не потрібно включати жодних адрес на початку ваших листів.
Як уникнути втрати балів в IELTS General Writing Task 1
Як уже згадувалося, не витрачайте більше 20 хвилин на це завдання і переконайтеся, що ви пишете щонайменше 150 слів, інакше вас оштрафують. Хоча вас не оштрафують за написання понад 150 слів, вам слід пам'ятати, що довша відповідь task 1 може означати, що у вас залишається менше часу на task 2, який вносить вдвічі більший внесок у band score Writing.
Вам також слід пам'ятати, що вас оштрафують за нерелевантність, якщо відповідь не по темі або не написана як повний, зв'язний текст (наприклад, використання маркерів у будь-якій частині відповіді або форма нотаток тощо). Вас сильно оштрафують за плагіат (тобто копіювання з іншого джерела).
Last weekend, your cousin celebrated her 50th birthday, but you couldn't attend and you forgot to cancel.
Write a letter to your cousin. In your letter:
- Apologize for missing the birthday celebration
- Explain why you missed it and why you hadn't let her know
- Describe how you will make it up to her
You do NOT need to write any addresses.
Begin your letter as follows:
Dear ___,
- Write at least 150 words.
- You should spend around 20 minutes on this task.
Dear Marnie,
Happy belated birthday! I hope you're doing well and that you had a great 50th birthday party.
I'm so sorry that I wasn't at your party to celebrate with you. It's been such a long time since we've been able to catch up and see each other.
To be completely honest, I've been swamped with work lately, and I was asked to go on a last-minute business trip a few days before your birthday. I was so busy that I had completely forgotten about your party, and it didn't occur to me to call you and cancel.
My busy schedule is absolutely not an excuse for missing your 50th birthday, though, and I would love to make it up to you. I've reserved a table for two next Friday night at the new sushi restaurant in town. Can I please treat you to a luxurious birthday dinner?
I hope we can celebrate together next Friday!
Speak to you soon,
Jessica
Total Word Count: 162 words

Task Achievement — Letter
Learn how to answer this question in a step-by-step interactive exercise
Task Achievement — Letter
В IELTS General Training Task 1 ви пишете лист у відповідь на певну ситуацію. Оцінка за Task Achievement залежить від того, чи розкрили ви кожен пункт завдання, бо навіть сильний лист, у якому пропущено один пункт, втрачає бали.
Прочитайте опис ситуації, пункти завдання й початкову фразу, якщо завдання її дає.
Перегляньте завдання, потім натисніть «Далі», щоб продовжити.
Перегляньте запитання
Write a letter to your cousin. In your letter:
- Apologize for missing the birthday celebration
- Explain why you missed it and why you hadn't let her know
- Describe how you will make it up to her
Write at least 150 words. You do NOT need to write any addresses.
Begin your letter as follows:
Dear ___,
Перш ніж писати, сплануйте лист, відповівши на три запитання. Кому ви пишете, чому ви пишете і що обов’язково має бути в листі?
Адресат визначає, наскільки офіційною має бути мова, мета визначає, як почати лист, а пункти завдання визначають зміст. Кожна відповідь уже є десь у завданні.
Зіставте кожне запитання для планування з частиною завдання, яка на нього відповідає.
Зрозумійте завдання
Зіставте кожне запитання для планування з частиною завдання, яка на нього відповідає.
Привітання і завершальна фраза показують читачеві, наскільки офіційний лист, тож вони мають відповідати людині, якій ви пишете. Лист незнайомцю чи керівникові офіційний, а лист другові неофіційний.
Тримайте обидва кінці листа на одному рівні. Офіційне привітання, після якого йде невимушене завершення, збиває читача з пантелику.
Виберіть привітання й завершальну фразу, які пасують адресатові.
Виберіть привітання і завершення
Confirm the greeting
- Dear ___,
- Dear Sir or Madam,
- Dear Ms. Smith,
- Hey you,
Choose a closing
- Speak to you soon,
- Lots of love,
- Best wishes,
- Yours faithfully,
- Yours sincerely,
Присвятіть першому пункту завдання окремий абзац. Task Achievement оцінюють за тим, чи кожен пункт розкрито й розвинено, а не лише згадано.
Для початку речення є готові фрази-зачини. Завершіть думку своїми словами й зберігайте той самий тон, що й у привітанні.
Напишіть абзац, який розкриває перший пункт завдання.
Розкрийте пункт списку 1
Apologise for missing the birthday celebration
Другий пункт завдання теж потребує окремого абзацу. Зробіть його такої самої довжини й так само детальним, як перший, бо пункт, на який ви відповіли лише наполовину, все одно коштує балів.
Почніть із фрази-зачину, а потім додайте деталі, які справді потрібні читачеві в цій ситуації.
Напишіть абзац, який розкриває другий пункт завдання.
Розкрийте пункт списку 2
Explain why you missed it and did not let her know
Завершіть основну частину листа третім пунктом завдання. Коли всі три пункти розкрито повними реченнями, завдання виконано.
Зберігайте однаковий тон до кінця й перевірте, що цей абзац відповідає саме на те, чого вимагав пункт завдання.
Напишіть абзац, який розкриває третій пункт завдання.
Розкрийте пункт списку 3
Describe how you will make it up to her
Ваші абзаци тепер разом складають один лист, із привітанням і завершальною фразою на своїх місцях. Прочитайте його як цілісний текст і перевірте, що кожен пункт завдання розкрито.
Порівняйте свої формулювання зі зразком листа й зверніть увагу, як тон залишається однаковим від привітання до завершальної фрази.
Перегляньте свій лист, потім натисніть «Далі», щоб продовжити.
Перегляньте свій готовий лист
Як вирішити
Лист Task 1 відповідає на певну ситуацію й охоплює кілька пунктів завдання. Оцінка за Task Achievement залежить від того, чи охоплено кожен пункт і чи відповідає тон адресатові.
Дотримуйтеся сталого порядку дій, щоб не пропустити жодного пункту, а рівень формальності залишався однаковим від початку до кінця.
- Зрозумійте завдання. З’ясуйте, кому ви пишете, навіщо пишете і що має бути в листі.
- Виберіть привітання і завершення. Доберіть звертання й завершальну фразу відповідно до адресата і тримайте їх на однаковому рівні формальності.
- Розкрийте пункти списку. Присвятіть кожному пункту завдання окремий абзац і розкрийте його реальними деталями.
- Перегляньте свій готовий лист. Прочитайте абзаци разом і перевірте, що кожен пункт завдання охоплено.
Пишіть по одному абзацу на кожен пункт завдання. Цей простий план майже унеможливлює пропуск пункту, а саме пропуск найшвидше коштує балів за Task Achievement.
План
Увесь лист можна спланувати за допомогою трьох запитань. Кому ви пишете, навіщо ви пишете і що обов’язково має бути в листі? Кожна відповідь уже є десь у завданні.
Тон
Привітання й завершальна фраза показують читачеві, наскільки офіційний лист. Лист незнайомій людині чи керівникові офіційний, лист другові неофіційний, а початок і кінець листа мають бути витримані в одному стилі.
Пункти списку
Кожен пункт завдання отримує власний абзац. Розкрийте його повними реченнями з тими деталями, які справді потрібні адресатові, і робіть абзаци приблизно однакової довжини, щоб жоден пункт не виглядав написаним поспіхом.
Для отримання додаткової інформації про IELTS General Writing Task 1, ознайомтеся з The Ultimate Guide for the IELTS General Writing Task 1
IELTS Writing Task 2
В IELTS writing task 2 вам потрібно буде написати есе традиційного стилю у відповідь на запитання. Ви маєте написати щонайменше 250 слів. Якщо ви не напишете достатньо слів, вас оштрафують. У task 2 є 6 різних типів запитань. Розгляньмо приклади запитань та зразки есе для кожного типу есе.
Причини та наслідки
У цьому типі запитання вам дадуть проблему чи ситуацію. Ваше завдання — описати причини ситуації та деякі наслідки ситуації.
It is observed that in many countries not enough students are choosing to study science at university. What are the causes? And what will be the effects on society?
- Write at least 250 words.
- You should spend around 40 minutes on this task.
It is a fact that many students globally are avoiding science in favor of other subjects at university. Such a trend is largely due to how science is perceived, which may be having a detrimental effect on a nation’s development.
The primary reason for the drop in enrollment in science-based courses is that many undergraduates are put off by their difficulty. While many high school students enjoy science, they soon find themselves facing a lot of theory and research based courses once in college. For example according to a recent poll of UK universities, many students stated that while science was interesting in high school, there was too much theory learnt in classes, and not enough application in the lab to make it interesting. Furthermore, there are plenty of easier alternatives such as humanities for students to choose from these days. As a result, most choose a more appealing humanities degree over a science one.
Countries with the lowest science enrollment rates are affected the most competitively and economically. Fewer science graduates mean a shortage of skilled researchers in science-related fields like bio-engineering which reduces a countries competitiveness in attracting foreign investment. In other words foreign companies are usually unwilling to invest in nations with a low pool of skilled workers. In addition, a low number of skilled workers mean fewer technological developments for such countries, which may cause their economies to suffer from lost business in being the first to market with new products. For example, evidence shows that the number of patents filed by Chinese corporations is beginning to threaten the number credited to American ones.
In conclusion, there is a direct correlation between the perceived difficulty of science degrees and limited economic growth. Only by changing this attitude will countries reverse this trend.
Task Achievement — Task 2
Learn how to answer this question in a step-by-step interactive exercise
Task Achievement — Task 2
В IELTS Writing Task 2 ви пишете есе, яке відповідає на кожну частину запитання. Уважно прочитайте твердження й рядок з інструкцією та зверніть увагу, що саме запитання просить обговорити.
Есе, яке тримається теми, але так і не відповідає на поставлене запитання, не може отримати високий бал.
Перегляньте запитання, потім натисніть «Далі», щоб продовжити.
Перегляньте запитання
Напишімо вступ із двох речень, загалом приблизно від 25 до 35 слів. Спершу перепишіть запитання своїми словами. Перефразуйте запитання, використовуючи власні слова й синоніми. Так ваше есе не відійде від теми, а ви зможете показати широкий словниковий запас. Друге речення називає конкретні теми, які ви обговорите в основних абзацах.
Напишіть вступ.
Напишіть вступ
Кожен основний абзац потребує тематичного речення, яке вводить його головну думку. Для есе такого обсягу достатньо двох основних абзаців.
Напишіть одне чітке речення для кожного абзацу. Кожне речення має містити від 12 до 20 слів, а пояснення й приклади залиште для наступних кроків.
Напишіть одне тематичне речення для кожного основного абзацу.
Напишіть два тематичні речення
science courses are seen as too hard
fewer scientists hurt the economy
Тематичне речення приносить бали, лише коли його підкріплено. Розвиньте перший основний абзац за допомогою двох аргументів. Для кожного аргументу напишіть пояснення й конкретний приклад.
Кожен основний абзац має складатися приблизно з 4–5 речень, або від 60 до 80 слів. Конкретна названа ситуація переконує більше, ніж загальне твердження.
Допишіть решту першого основного абзацу.
Розгорніть основний абзац 1
60
Розвиньте другий основний абзац так само глибоко, як перший. Наведіть два аргументи й підкріпіть кожен поясненням і прикладом.
Кожен основний абзац має складатися приблизно з 4–5 речень, або від 60 до 80 слів. Не повторюйте перший абзац іншими словами.
Допишіть решту другого основного абзацу.
Розгорніть основний абзац 2
60
Висновок завершує есе. Напишіть підсумок головних думок у двох реченнях, потім додайте одне або два речення про те, чому ця тема важлива.
Не копіюйте вступ і не додавайте нового аргументу. Увесь висновок має містити від 35 до 50 слів.
Напишіть висновок із 3–4 речень.
Напишіть висновок
35
Ваш вступ, тематичні речення, основні абзаци й висновок тепер разом складають одне есе. Прочитайте його як цілісний текст і перевірте, що воно відповідає на кожну частину запитання.
Порівняйте свої формулювання зі зразком есе й зверніть увагу, що кожен абзац виконує своє окреме завдання.
Перегляньте своє есе, потім натисніть «Далі», щоб продовжити.
Перегляньте своє готове есе
Як вирішити
Есе Task 2 відповідає на кожну частину запитання. Оцінка за Task Achievement залежить від того, чи охоплено все, про що питає завдання, і чи підтверджено кожну головну думку поясненням і прикладом.
Дотримуйтеся сталого порядку дій: вступ, два тематичні речення, два розгорнуті основні абзаци, потім висновок.
- Напишіть вступ.
Зазвичай для цього абзацу вам знадобляться два речення. Перефразуйте запитання своїми словами, використовуючи синоніми. Так ваше есе не відійде від теми, а ви зможете показати широкий словниковий запас. Друге речення представляє конкретні теми, які ви розглянете в основних абзацах. Отже, ваш вступ має містити:
- Перефразоване запитання
- Представлення конкретних тем
- Напишіть два тематичні речення. Напишіть по одному тематичному реченню для кожного основного абзацу.
- Розгорніть основні абзаци. Підтвердьте кожен основний абзац двома пунктами й дайте кожному пункту пояснення та приклад. Кожен основний абзац має містити приблизно 4–5 речень.
- Напишіть висновок. Підсумуйте головні думки, а потім скажіть, чому ця тема важлива.
- Перегляньте своє готове есе. Прочитайте всі частини разом і перевірте, що ви відповіли на кожну частину запитання.
Два розгорнуті абзаци отримують вищу оцінку, ніж чотири нерозгорнуті пункти. Екзаменатори винагороджують аргументацію, тож краще додайте пояснення й приклад до пункту, який у вас уже є, ніж ще один пункт.
Вступ
Зазвичай для цього абзацу вам знадобляться два речення. Перефразуйте запитання своїми словами, використовуючи синоніми. Так ваше есе не відійде від теми, а ви зможете показати широкий словниковий запас. Друге речення представляє конкретні теми, які ви розглянете в основних абзацах. Отже, ваш вступ має містити:
- Перефразоване запитання
- Представлення конкретних тем
Тематичні речення
Напишіть по одному тематичному реченню для кожного основного абзацу. Кожне речення має представити головну думку свого абзацу в 12–20 словах, а приклади залиште для наступного етапу.
Аргументація
Тематичне речення приносить бали, коли воно підкріплене аргументами. Поясніть, чому думка правильна, наведіть конкретний приклад і дайте обом основним абзацам однаковий обсяг аргументації. Кожен основний абзац має містити приблизно 4–5 речень.
Висновок
Висновок підсумовує головні думки у двох реченнях, а потім додає одне-два речення про те, чому ця тема важлива. Не копіюйте вступ і не додавайте нового аргументу.
Обговоріть обидва погляди та подайте свою власну думку
У цьому типі запитання вам дадуть дві протилежні точки зору, пов'язані з питанням. Зазвичай дві точки зору будуть в окремих реченнях, з'єднаних перехідним словом, таким як "however", щоб вказати, що дві точки зору суперечать. Ваше завдання — написати дискурсивне есе, протиставляючи обидві сторони питання та подаючи свою власну думку.
Some people argue that the public should be allowed to have guns. Others do not agree. Discuss both points of view and give your opinion.
- Write at least 250 words.
- You should spend around 40 minutes on this task.
Gun ownership is a controversial topic with some people arguing that the public should have the choice to own them, while others disagree wholeheartedly with the idea. In my opinion, I believe that the public should only be entitled to own guns after having proper training.
The benefits of gun ownership are touted in some countries more than others. In countries where owning one is a civic right, like the United States, it is legal to use one in self-defense is legal. With muggings, murder and burglary rising in many countries, there may be some truth to the claim that owing a gun gives the owner increased security. Furthermore, in remote or dangerous areas, guns may be a necessity rather than an option. Without police nearby, properly stored, guns may be a great asset in deterring criminals from breaking and entering a remote property.
However, rather than deter violence, guns tend to escalate it in areas where they are widely available. Research shows that violent crime increases dramatically when guns are prevalent in society. When the public is armed, criminals and the police become so too, creating a situation in which guns beget more guns and eventually death. Additionally, greater ease of access is dangerous for children. Having a gun easily accessible may tempt children to abuse them as evidenced by the almost weekly school shootings in the US. There is further a proven link between increased suicide rates when guns are present.
It is my belief that the general public should be barred from owning guns of any kind. Also, guns should be restricted to specialists with a proven need for a firearm such as soldiers or hunters. While there are certain circumstances where owning a gun is an advantage, in the vast majority of situations there is no place for a gun in modern society.
Task Achievement — Task 2
Learn how to answer this question in a step-by-step interactive exercise
Task Achievement — Task 2
В IELTS Writing Task 2 ви пишете есе, яке відповідає на кожну частину запитання. Уважно прочитайте твердження й рядок з інструкцією та зверніть увагу, що саме запитання просить обговорити.
Есе, яке тримається теми, але так і не відповідає на поставлене запитання, не може отримати високий бал.
Перегляньте запитання, потім натисніть «Далі», щоб продовжити.
Перегляньте запитання
Напишімо вступ із двох речень, загалом приблизно від 25 до 35 слів. Спершу перепишіть запитання своїми словами. Перефразуйте запитання, використовуючи власні слова й синоніми. Так ваше есе не відійде від теми, а ви зможете показати широкий словниковий запас. Друге речення називає конкретні теми, які ви обговорите в основних абзацах.
Напишіть вступ.
Напишіть вступ
Кожен основний абзац потребує тематичного речення, яке вводить його головну думку. Для есе такого обсягу достатньо двох основних абзаців.
Напишіть одне чітке речення для кожного абзацу. Кожне речення має містити від 12 до 20 слів, а пояснення й приклади залиште для наступних кроків.
Напишіть одне тематичне речення для кожного основного абзацу.
Напишіть два тематичні речення
guns help people defend themselves
more guns lead to more violence
Тематичне речення приносить бали, лише коли його підкріплено. Розвиньте перший основний абзац за допомогою двох аргументів. Для кожного аргументу напишіть пояснення й конкретний приклад.
Кожен основний абзац має складатися приблизно з 4–5 речень, або від 60 до 80 слів. Конкретна названа ситуація переконує більше, ніж загальне твердження.
Допишіть решту першого основного абзацу.
Розгорніть основний абзац 1
60
Розвиньте другий основний абзац так само глибоко, як перший. Наведіть два аргументи й підкріпіть кожен поясненням і прикладом.
Кожен основний абзац має складатися приблизно з 4–5 речень, або від 60 до 80 слів. Не повторюйте перший абзац іншими словами.
Допишіть решту другого основного абзацу.
Розгорніть основний абзац 2
60
Висновок завершує есе. Напишіть підсумок головних думок у двох реченнях, потім додайте одне або два речення про те, чому ця тема важлива.
Не копіюйте вступ і не додавайте нового аргументу. Увесь висновок має містити від 35 до 50 слів.
Напишіть висновок із 3–4 речень.
Напишіть висновок
35
Ваш вступ, тематичні речення, основні абзаци й висновок тепер разом складають одне есе. Прочитайте його як цілісний текст і перевірте, що воно відповідає на кожну частину запитання.
Порівняйте свої формулювання зі зразком есе й зверніть увагу, що кожен абзац виконує своє окреме завдання.
Перегляньте своє есе, потім натисніть «Далі», щоб продовжити.
Перегляньте своє готове есе
Як вирішити
Есе Task 2 відповідає на кожну частину запитання. Оцінка за Task Achievement залежить від того, чи охоплено все, про що питає завдання, і чи підтверджено кожну головну думку поясненням і прикладом.
Дотримуйтеся сталого порядку дій: вступ, два тематичні речення, два розгорнуті основні абзаци, потім висновок.
- Напишіть вступ.
Зазвичай для цього абзацу вам знадобляться два речення. Перефразуйте запитання своїми словами, використовуючи синоніми. Так ваше есе не відійде від теми, а ви зможете показати широкий словниковий запас. Друге речення представляє конкретні теми, які ви розглянете в основних абзацах. Отже, ваш вступ має містити:
- Перефразоване запитання
- Представлення конкретних тем
- Напишіть два тематичні речення. Напишіть по одному тематичному реченню для кожного основного абзацу.
- Розгорніть основні абзаци. Підтвердьте кожен основний абзац двома пунктами й дайте кожному пункту пояснення та приклад. Кожен основний абзац має містити приблизно 4–5 речень.
- Напишіть висновок. Підсумуйте головні думки, а потім скажіть, чому ця тема важлива.
- Перегляньте своє готове есе. Прочитайте всі частини разом і перевірте, що ви відповіли на кожну частину запитання.
Два розгорнуті абзаци отримують вищу оцінку, ніж чотири нерозгорнуті пункти. Екзаменатори винагороджують аргументацію, тож краще додайте пояснення й приклад до пункту, який у вас уже є, ніж ще один пункт.
Вступ
Зазвичай для цього абзацу вам знадобляться два речення. Перефразуйте запитання своїми словами, використовуючи синоніми. Так ваше есе не відійде від теми, а ви зможете показати широкий словниковий запас. Друге речення представляє конкретні теми, які ви розглянете в основних абзацах. Отже, ваш вступ має містити:
- Перефразоване запитання
- Представлення конкретних тем
Тематичні речення
Напишіть по одному тематичному реченню для кожного основного абзацу. Кожне речення має представити головну думку свого абзацу в 12–20 словах, а приклади залиште для наступного етапу.
Аргументація
Тематичне речення приносить бали, коли воно підкріплене аргументами. Поясніть, чому думка правильна, наведіть конкретний приклад і дайте обом основним абзацам однаковий обсяг аргументації. Кожен основний абзац має містити приблизно 4–5 речень.
Висновок
Висновок підсумовує головні думки у двох реченнях, а потім додає одне-два речення про те, чому ця тема важлива. Не копіюйте вступ і не додавайте нового аргументу.
Переваги та недоліки
У цьому типі запитання вас попросять обговорити позитивні та негативні аспекти ситуації, рішення чи тенденції. Вас також можуть попросити дати свою думку про те, яку сторону ви вважаєте важливішою.
In some countries, governments are encouraging industries and businesses to move to regional areas outside the big cities. Do the advantages of this trend outweigh the disadvantages?
- Write at least 250 words.
- You should spend around 40 minutes on this task.
There is a movement among some countries to promote regional areas away from cities as attractive to business and industry. In my opinion, I consider relocation of business to bring about more drawbacks than benefits over the long term.
There are several attractive benefits to businesses moving to regional areas. For businesses rural locations mean lower land prices. Cheaper land allows large or small business equal prospects to become established cheaply with additional room to expand. As an example, the average size of a business in UK cities is currently 25 square meters while those in the rural locales average around 50m2. Additionally, countries benefits principally from the direct investment in underperforming parts of the country. Having companies operating in less urbanized areas, creates jobs, attracts talent and increases immigration which brings greater wealth.
On the other hand, relocation is not without its drawbacks. For one thing, locations away from population centers may mean a greater distance to market for goods. As a result, cost savings from cheaper land may be mitigated by the increased transportation costs of shipping products to customers. For another thing, there are often fewer skilled workers in regional areas. It may not be easy to attract employees to work in out-of-the-way places, which would mean longer commutes for staff from nearby cities at the expense of the company coffers. Lastly, increased business in country areas, disturbs the life of local residents. Country roads are not built for heavy trucks or traffic which may cause increased noise, congestions and inconvenience to those living nearby.
To sum up, while regional settings may be well suited to certain internet-based businesses, for more traditional companies, the distance from the city presents many challenges to overcome.
Task Achievement — Task 2
Learn how to answer this question in a step-by-step interactive exercise
Task Achievement — Task 2
В IELTS Writing Task 2 ви пишете есе, яке відповідає на кожну частину запитання. Уважно прочитайте твердження й рядок з інструкцією та зверніть увагу, що саме запитання просить обговорити.
Есе, яке тримається теми, але так і не відповідає на поставлене запитання, не може отримати високий бал.
Перегляньте запитання, потім натисніть «Далі», щоб продовжити.
Перегляньте запитання
Напишімо вступ із двох речень, загалом приблизно від 25 до 35 слів. Спершу перепишіть запитання своїми словами. Перефразуйте запитання, використовуючи власні слова й синоніми. Так ваше есе не відійде від теми, а ви зможете показати широкий словниковий запас. Друге речення називає конкретні теми, які ви обговорите в основних абзацах.
Напишіть вступ.
Напишіть вступ
Кожен основний абзац потребує тематичного речення, яке вводить його головну думку. Для есе такого обсягу достатньо двох основних абзаців.
Напишіть одне чітке речення для кожного абзацу. Кожне речення має містити від 12 до 20 слів, а пояснення й приклади залиште для наступних кроків.
Напишіть одне тематичне речення для кожного основного абзацу.
Напишіть два тематичні речення
cheaper land and new jobs in the regions
higher transport costs and fewer skilled workers
Тематичне речення приносить бали, лише коли його підкріплено. Розвиньте перший основний абзац за допомогою двох аргументів. Для кожного аргументу напишіть пояснення й конкретний приклад.
Кожен основний абзац має складатися приблизно з 4–5 речень, або від 60 до 80 слів. Конкретна названа ситуація переконує більше, ніж загальне твердження.
Допишіть решту першого основного абзацу.
Розгорніть основний абзац 1
60
Розвиньте другий основний абзац так само глибоко, як перший. Наведіть два аргументи й підкріпіть кожен поясненням і прикладом.
Кожен основний абзац має складатися приблизно з 4–5 речень, або від 60 до 80 слів. Не повторюйте перший абзац іншими словами.
Допишіть решту другого основного абзацу.
Розгорніть основний абзац 2
60
Висновок завершує есе. Напишіть підсумок головних думок у двох реченнях, потім додайте одне або два речення про те, чому ця тема важлива.
Не копіюйте вступ і не додавайте нового аргументу. Увесь висновок має містити від 35 до 50 слів.
Напишіть висновок із 3–4 речень.
Напишіть висновок
35
Ваш вступ, тематичні речення, основні абзаци й висновок тепер разом складають одне есе. Прочитайте його як цілісний текст і перевірте, що воно відповідає на кожну частину запитання.
Порівняйте свої формулювання зі зразком есе й зверніть увагу, що кожен абзац виконує своє окреме завдання.
Перегляньте своє есе, потім натисніть «Далі», щоб продовжити.
Перегляньте своє готове есе
Як вирішити
Есе Task 2 відповідає на кожну частину запитання. Оцінка за Task Achievement залежить від того, чи охоплено все, про що питає завдання, і чи підтверджено кожну головну думку поясненням і прикладом.
Дотримуйтеся сталого порядку дій: вступ, два тематичні речення, два розгорнуті основні абзаци, потім висновок.
- Напишіть вступ.
Зазвичай для цього абзацу вам знадобляться два речення. Перефразуйте запитання своїми словами, використовуючи синоніми. Так ваше есе не відійде від теми, а ви зможете показати широкий словниковий запас. Друге речення представляє конкретні теми, які ви розглянете в основних абзацах. Отже, ваш вступ має містити:
- Перефразоване запитання
- Представлення конкретних тем
- Напишіть два тематичні речення. Напишіть по одному тематичному реченню для кожного основного абзацу.
- Розгорніть основні абзаци. Підтвердьте кожен основний абзац двома пунктами й дайте кожному пункту пояснення та приклад. Кожен основний абзац має містити приблизно 4–5 речень.
- Напишіть висновок. Підсумуйте головні думки, а потім скажіть, чому ця тема важлива.
- Перегляньте своє готове есе. Прочитайте всі частини разом і перевірте, що ви відповіли на кожну частину запитання.
Два розгорнуті абзаци отримують вищу оцінку, ніж чотири нерозгорнуті пункти. Екзаменатори винагороджують аргументацію, тож краще додайте пояснення й приклад до пункту, який у вас уже є, ніж ще один пункт.
Вступ
Зазвичай для цього абзацу вам знадобляться два речення. Перефразуйте запитання своїми словами, використовуючи синоніми. Так ваше есе не відійде від теми, а ви зможете показати широкий словниковий запас. Друге речення представляє конкретні теми, які ви розглянете в основних абзацах. Отже, ваш вступ має містити:
- Перефразоване запитання
- Представлення конкретних тем
Тематичні речення
Напишіть по одному тематичному реченню для кожного основного абзацу. Кожне речення має представити головну думку свого абзацу в 12–20 словах, а приклади залиште для наступного етапу.
Аргументація
Тематичне речення приносить бали, коли воно підкріплене аргументами. Поясніть, чому думка правильна, наведіть конкретний приклад і дайте обом основним абзацам однаковий обсяг аргументації. Кожен основний абзац має містити приблизно 4–5 речень.
Висновок
Висновок підсумовує головні думки у двох реченнях, а потім додає одне-два речення про те, чому ця тема важлива. Не копіюйте вступ і не додавайте нового аргументу.
Проблеми та рішення
У цьому типі запитання вам дадуть проблему чи ситуацію. Ваше завдання — описати причини ситуації та деякі рішення проблеми. Запитання може попросити загальних рішень (наприклад, як могла б бути вирішена ця проблема) або попросити, як конкретні групи можуть вирішити проблему (наприклад, які кроки можуть зробити уряди та індивіди для вирішення проблеми?). Вам не потрібно детально згадувати наслідки, лише коротко.
More and more wild animals are on the verge of extinction and others are on the endangered list. What are the reasons for this? What can be done to solve this problem?
- Write at least 250 words.
- You should spend around 40 minutes on this task.
The number of critically endangered animals is growing significantly, while a disturbing number of other species have become threatened. This worrying trend stems from several causes, though solutions exist where the will to implement them is present.
Regarding species on the critically endangered list, outmoded beliefs in Eastern medicine that endangered animal parts have medicinal qualities is driving demand for them, particularly in China. Animals are needlessly killed to cure ailments from infertility to arthritis, and China’s increasing affluence mean demand is expected to increase even further. Despite this, limited action by governments has proven ineffective at stopping such a trade. Many species threatened with extinction live in national parks, typically in developing countries. However, chronic underfunding means officials there are powerless to catch poachers, and corruption means the ones who are caught, often get away.
Where political will is available, several solutions may help. To begin with, developed countries could help fund budgets to protect endangered species in poorer countries. While this doesn’t solve the issue of corruption, it would increase deterrence and hopefully reduce the number of animals needlessly killed. More meaningfully, in countries where animal parts are bought and sold, laws should be more strictly enforced and punishments massively increased to discourage both sellers and buyers alike. A concerted education campaign should also be effected to stamp out the perception that animal parts have any curative properties to reduce the market for such ‘goods’ once and for all.
In conclusion, removing the market for animal parts, and better protecting the endangered animals that remain may help preserve the world’s natural heritage before it is too late.
Further reasons to consider:
Development destroying their habitat and food sourceGrowing cities and farmland encroach on habitatMany animals cannot find the place to raise their youngFurther solutions to consider:
Increase government budgets to protect animalsFor example, the panda is now rebounding in Southern China due to concerted government efforts to protect it.Task Achievement — Task 2
Learn how to answer this question in a step-by-step interactive exercise
Task Achievement — Task 2
В IELTS Writing Task 2 ви пишете есе, яке відповідає на кожну частину запитання. Уважно прочитайте твердження й рядок з інструкцією та зверніть увагу, що саме запитання просить обговорити.
Есе, яке тримається теми, але так і не відповідає на поставлене запитання, не може отримати високий бал.
Перегляньте запитання, потім натисніть «Далі», щоб продовжити.
Перегляньте запитання
Напишімо вступ із двох речень, загалом приблизно від 25 до 35 слів. Спершу перепишіть запитання своїми словами. Перефразуйте запитання, використовуючи власні слова й синоніми. Так ваше есе не відійде від теми, а ви зможете показати широкий словниковий запас. Друге речення називає конкретні теми, які ви обговорите в основних абзацах.
Напишіть вступ.
Напишіть вступ
Кожен основний абзац потребує тематичного речення, яке вводить його головну думку. Для есе такого обсягу достатньо двох основних абзаців.
Напишіть одне чітке речення для кожного абзацу. Кожне речення має містити від 12 до 20 слів, а пояснення й приклади залиште для наступних кроків.
Напишіть одне тематичне речення для кожного основного абзацу.
Напишіть два тематичні речення
animals are killed for traditional medicine
more funding, stricter laws and education
Тематичне речення приносить бали, лише коли його підкріплено. Розвиньте перший основний абзац за допомогою двох аргументів. Для кожного аргументу напишіть пояснення й конкретний приклад.
Кожен основний абзац має складатися приблизно з 4–5 речень, або від 60 до 80 слів. Конкретна названа ситуація переконує більше, ніж загальне твердження.
Допишіть решту першого основного абзацу.
Розгорніть основний абзац 1
60
Розвиньте другий основний абзац так само глибоко, як перший. Наведіть два аргументи й підкріпіть кожен поясненням і прикладом.
Кожен основний абзац має складатися приблизно з 4–5 речень, або від 60 до 80 слів. Не повторюйте перший абзац іншими словами.
Допишіть решту другого основного абзацу.
Розгорніть основний абзац 2
60
Висновок завершує есе. Напишіть підсумок головних думок у двох реченнях, потім додайте одне або два речення про те, чому ця тема важлива.
Не копіюйте вступ і не додавайте нового аргументу. Увесь висновок має містити від 35 до 50 слів.
Напишіть висновок із 3–4 речень.
Напишіть висновок
35
Ваш вступ, тематичні речення, основні абзаци й висновок тепер разом складають одне есе. Прочитайте його як цілісний текст і перевірте, що воно відповідає на кожну частину запитання.
Порівняйте свої формулювання зі зразком есе й зверніть увагу, що кожен абзац виконує своє окреме завдання.
Перегляньте своє есе, потім натисніть «Далі», щоб продовжити.
Перегляньте своє готове есе
Як вирішити
Есе Task 2 відповідає на кожну частину запитання. Оцінка за Task Achievement залежить від того, чи охоплено все, про що питає завдання, і чи підтверджено кожну головну думку поясненням і прикладом.
Дотримуйтеся сталого порядку дій: вступ, два тематичні речення, два розгорнуті основні абзаци, потім висновок.
- Напишіть вступ.
Зазвичай для цього абзацу вам знадобляться два речення. Перефразуйте запитання своїми словами, використовуючи синоніми. Так ваше есе не відійде від теми, а ви зможете показати широкий словниковий запас. Друге речення представляє конкретні теми, які ви розглянете в основних абзацах. Отже, ваш вступ має містити:
- Перефразоване запитання
- Представлення конкретних тем
- Напишіть два тематичні речення. Напишіть по одному тематичному реченню для кожного основного абзацу.
- Розгорніть основні абзаци. Підтвердьте кожен основний абзац двома пунктами й дайте кожному пункту пояснення та приклад. Кожен основний абзац має містити приблизно 4–5 речень.
- Напишіть висновок. Підсумуйте головні думки, а потім скажіть, чому ця тема важлива.
- Перегляньте своє готове есе. Прочитайте всі частини разом і перевірте, що ви відповіли на кожну частину запитання.
Два розгорнуті абзаци отримують вищу оцінку, ніж чотири нерозгорнуті пункти. Екзаменатори винагороджують аргументацію, тож краще додайте пояснення й приклад до пункту, який у вас уже є, ніж ще один пункт.
Вступ
Зазвичай для цього абзацу вам знадобляться два речення. Перефразуйте запитання своїми словами, використовуючи синоніми. Так ваше есе не відійде від теми, а ви зможете показати широкий словниковий запас. Друге речення представляє конкретні теми, які ви розглянете в основних абзацах. Отже, ваш вступ має містити:
- Перефразоване запитання
- Представлення конкретних тем
Тематичні речення
Напишіть по одному тематичному реченню для кожного основного абзацу. Кожне речення має представити головну думку свого абзацу в 12–20 словах, а приклади залиште для наступного етапу.
Аргументація
Тематичне речення приносить бали, коли воно підкріплене аргументами. Поясніть, чому думка правильна, наведіть конкретний приклад і дайте обом основним абзацам однаковий обсяг аргументації. Кожен основний абзац має містити приблизно 4–5 речень.
Висновок
Висновок підсумовує головні думки у двох реченнях, а потім додає одне-два речення про те, чому ця тема важлива. Не копіюйте вступ і не додавайте нового аргументу.
Двочастинне запитання
У цьому типі запитання вам дадуть два запитання, і вам потрібно буде відповісти на обидва запитання. Ці два запитання будуть різними. Наприклад, вам може знадобитися оцінити важливість ідеї чи дії (наприклад, наскільки це важливо?) і сказати, чи погоджуєтеся ви чи не погоджуєтеся (наприклад, чи погоджуєтеся ви чи не погоджуєтеся?).
News editors decide what to broadcast on television and what to print in newspapers. What factors do you think influence these decisions? Do you think that there is too much emphasis on bad news these days?
- Write at least 250 words.
- You should spend around 40 minutes on this task.
In the news business, editors have the final say in what makes it to air, or what makes it to print in newspapers. There are a variety of factors that affect their decision making; however, in my opinion, the public is inundated with negative news content, and more positive news would be beneficial to all.
Regarding news stories worth focusing on, editors must weigh up a number of aspects. For one thing, timing is a major factor in choosing stories to inform the public, especially ones that affect many people. Stories that happen right away are classified as newsworthy, however, if the same story happens again, it’s no longer interesting. For another, proximity to a story is important. Stories that happen closer to home become more newsworthy than those far away, so domestic news stories become more noteworthy than international ones. Finally, human interest stories always garner attention since they don’t date quickly, and often offer an emotion connection with the audience.
However, to my mind most news shared with the public is of a negative slant. Through TV, print and online media, society is inundated with stories of crime, disasters, and war to the point that the good news becomes exceptional. As a result, people have become accustomed to this trend and become more anxious about the state of the world. For this reason, I believe having a greater proportion of positive news in the media would benefit everyone. Stories of human interest, scientific discovery or human achievement help everyone understand the world around them, and make better decisions. That way, society can better understand the world rather than simply view it as a dangerous place.
In conclusion, although news editors face a lot of challenges in choosing newsworthy stories, I believe a more optimistic approach would add further value to the news profession.
Task Achievement — Task 2
Learn how to answer this question in a step-by-step interactive exercise
Task Achievement — Task 2
В IELTS Writing Task 2 ви пишете есе, яке відповідає на кожну частину запитання. Уважно прочитайте твердження й рядок з інструкцією та зверніть увагу, що саме запитання просить обговорити.
Есе, яке тримається теми, але так і не відповідає на поставлене запитання, не може отримати високий бал.
Перегляньте запитання, потім натисніть «Далі», щоб продовжити.
Перегляньте запитання
Напишімо вступ із двох речень, загалом приблизно від 25 до 35 слів. Спершу перепишіть запитання своїми словами. Перефразуйте запитання, використовуючи власні слова й синоніми. Так ваше есе не відійде від теми, а ви зможете показати широкий словниковий запас. Друге речення називає конкретні теми, які ви обговорите в основних абзацах.
Напишіть вступ.
Напишіть вступ
Кожен основний абзац потребує тематичного речення, яке вводить його головну думку. Для есе такого обсягу достатньо двох основних абзаців.
Напишіть одне чітке речення для кожного абзацу. Кожне речення має містити від 12 до 20 слів, а пояснення й приклади залиште для наступних кроків.
Напишіть одне тематичне речення для кожного основного абзацу.
Напишіть два тематичні речення
timing, distance and human interest
too much bad news makes people anxious
Тематичне речення приносить бали, лише коли його підкріплено. Розвиньте перший основний абзац за допомогою двох аргументів. Для кожного аргументу напишіть пояснення й конкретний приклад.
Кожен основний абзац має складатися приблизно з 4–5 речень, або від 60 до 80 слів. Конкретна названа ситуація переконує більше, ніж загальне твердження.
Допишіть решту першого основного абзацу.
Розгорніть основний абзац 1
60
Розвиньте другий основний абзац так само глибоко, як перший. Наведіть два аргументи й підкріпіть кожен поясненням і прикладом.
Кожен основний абзац має складатися приблизно з 4–5 речень, або від 60 до 80 слів. Не повторюйте перший абзац іншими словами.
Допишіть решту другого основного абзацу.
Розгорніть основний абзац 2
60
Висновок завершує есе. Напишіть підсумок головних думок у двох реченнях, потім додайте одне або два речення про те, чому ця тема важлива.
Не копіюйте вступ і не додавайте нового аргументу. Увесь висновок має містити від 35 до 50 слів.
Напишіть висновок із 3–4 речень.
Напишіть висновок
35
Ваш вступ, тематичні речення, основні абзаци й висновок тепер разом складають одне есе. Прочитайте його як цілісний текст і перевірте, що воно відповідає на кожну частину запитання.
Порівняйте свої формулювання зі зразком есе й зверніть увагу, що кожен абзац виконує своє окреме завдання.
Перегляньте своє есе, потім натисніть «Далі», щоб продовжити.
Перегляньте своє готове есе
Як вирішити
Есе Task 2 відповідає на кожну частину запитання. Оцінка за Task Achievement залежить від того, чи охоплено все, про що питає завдання, і чи підтверджено кожну головну думку поясненням і прикладом.
Дотримуйтеся сталого порядку дій: вступ, два тематичні речення, два розгорнуті основні абзаци, потім висновок.
- Напишіть вступ.
Зазвичай для цього абзацу вам знадобляться два речення. Перефразуйте запитання своїми словами, використовуючи синоніми. Так ваше есе не відійде від теми, а ви зможете показати широкий словниковий запас. Друге речення представляє конкретні теми, які ви розглянете в основних абзацах. Отже, ваш вступ має містити:
- Перефразоване запитання
- Представлення конкретних тем
- Напишіть два тематичні речення. Напишіть по одному тематичному реченню для кожного основного абзацу.
- Розгорніть основні абзаци. Підтвердьте кожен основний абзац двома пунктами й дайте кожному пункту пояснення та приклад. Кожен основний абзац має містити приблизно 4–5 речень.
- Напишіть висновок. Підсумуйте головні думки, а потім скажіть, чому ця тема важлива.
- Перегляньте своє готове есе. Прочитайте всі частини разом і перевірте, що ви відповіли на кожну частину запитання.
Два розгорнуті абзаци отримують вищу оцінку, ніж чотири нерозгорнуті пункти. Екзаменатори винагороджують аргументацію, тож краще додайте пояснення й приклад до пункту, який у вас уже є, ніж ще один пункт.
Вступ
Зазвичай для цього абзацу вам знадобляться два речення. Перефразуйте запитання своїми словами, використовуючи синоніми. Так ваше есе не відійде від теми, а ви зможете показати широкий словниковий запас. Друге речення представляє конкретні теми, які ви розглянете в основних абзацах. Отже, ваш вступ має містити:
- Перефразоване запитання
- Представлення конкретних тем
Тематичні речення
Напишіть по одному тематичному реченню для кожного основного абзацу. Кожне речення має представити головну думку свого абзацу в 12–20 словах, а приклади залиште для наступного етапу.
Аргументація
Тематичне речення приносить бали, коли воно підкріплене аргументами. Поясніть, чому думка правильна, наведіть конкретний приклад і дайте обом основним абзацам однаковий обсяг аргументації. Кожен основний абзац має містити приблизно 4–5 речень.
Висновок
Висновок підсумовує головні думки у двох реченнях, а потім додає одне-два речення про те, чому ця тема важлива. Не копіюйте вступ і не додавайте нового аргументу.
Думка
У цьому типі запитання вам дадуть запитання, що містить думку. Ваше завдання — написати есе у відповідь на думку. Цей тип запитання часто запитує, чи погоджуєтеся ви чи не погоджуєтеся з думкою.
Some people are concerned that children spend too much time on computers – playing games, chatting and watching videos. But all this time is actually good preparation for children, who will have to spend many hours working on computers throughout their education and their working lives.To what extent do you agree or disagree with this statement?
- Write at least 250 words.
- You should spend around 40 minutes on this task.
With all the time that children spend engaged in various activities on computers, some people believe this is good preparation for a future in which many will work on computers full time through school and at work. I completely oppose this belief for several reasons.
To begin with, time on computers learning computer skills cannot be equated with that spent playing games or chatting online. While there may be some truth that videos games increase problem solving and analytical skills, there is no evidence to suggest that they improve other workplace skills. The skills children really need in a future work place are coding, designing, and software skills to name a few. The only way to ensure they learn these is for adults to be on hand to teach and supervise such learning.
Furthermore, spending too much time online may further have negative consequences to a child’s mental health. Unsupervised time on computers can result in children encountering inappropriate content online. Children have an extremely short attention span so are easily distracted by what they see or encounter online. There’s also the very real risk that children become addicted to the video games they play. Video game addiction is a proven disorder and affects many children in the US today. The quick-reward based system of such games is attractive and negatively affects how children learn and are motivated.
In conclusion, unless a child wishes to be a video game designer, increased computer time not only has little value to them beyond entertainment, it may even negatively affect a child’s development in the long term. Children should be supervised by adults when using computers to ensure they learn what they’re supposed to.
Task Achievement — Task 2
Learn how to answer this question in a step-by-step interactive exercise
Task Achievement — Task 2
В IELTS Writing Task 2 ви пишете есе, яке відповідає на кожну частину запитання. Уважно прочитайте твердження й рядок з інструкцією та зверніть увагу, що саме запитання просить обговорити.
Есе, яке тримається теми, але так і не відповідає на поставлене запитання, не може отримати високий бал.
Перегляньте запитання, потім натисніть «Далі», щоб продовжити.
Перегляньте запитання
Напишімо вступ із двох речень, загалом приблизно від 25 до 35 слів. Спершу перепишіть запитання своїми словами. Перефразуйте запитання, використовуючи власні слова й синоніми. Так ваше есе не відійде від теми, а ви зможете показати широкий словниковий запас. Друге речення називає конкретні теми, які ви обговорите в основних абзацах.
Напишіть вступ.
Напишіть вступ
Кожен основний абзац потребує тематичного речення, яке вводить його головну думку. Для есе такого обсягу достатньо двох основних абзаців.
Напишіть одне чітке речення для кожного абзацу. Кожне речення має містити від 12 до 20 слів, а пояснення й приклади залиште для наступних кроків.
Напишіть одне тематичне речення для кожного основного абзацу.
Напишіть два тематичні речення
games do not teach work skills
too much screen time harms children
Тематичне речення приносить бали, лише коли його підкріплено. Розвиньте перший основний абзац за допомогою двох аргументів. Для кожного аргументу напишіть пояснення й конкретний приклад.
Кожен основний абзац має складатися приблизно з 4–5 речень, або від 60 до 80 слів. Конкретна названа ситуація переконує більше, ніж загальне твердження.
Допишіть решту першого основного абзацу.
Розгорніть основний абзац 1
60
Розвиньте другий основний абзац так само глибоко, як перший. Наведіть два аргументи й підкріпіть кожен поясненням і прикладом.
Кожен основний абзац має складатися приблизно з 4–5 речень, або від 60 до 80 слів. Не повторюйте перший абзац іншими словами.
Допишіть решту другого основного абзацу.
Розгорніть основний абзац 2
60
Висновок завершує есе. Напишіть підсумок головних думок у двох реченнях, потім додайте одне або два речення про те, чому ця тема важлива.
Не копіюйте вступ і не додавайте нового аргументу. Увесь висновок має містити від 35 до 50 слів.
Напишіть висновок із 3–4 речень.
Напишіть висновок
35
Ваш вступ, тематичні речення, основні абзаци й висновок тепер разом складають одне есе. Прочитайте його як цілісний текст і перевірте, що воно відповідає на кожну частину запитання.
Порівняйте свої формулювання зі зразком есе й зверніть увагу, що кожен абзац виконує своє окреме завдання.
Перегляньте своє есе, потім натисніть «Далі», щоб продовжити.
Перегляньте своє готове есе
Як вирішити
Есе Task 2 відповідає на кожну частину запитання. Оцінка за Task Achievement залежить від того, чи охоплено все, про що питає завдання, і чи підтверджено кожну головну думку поясненням і прикладом.
Дотримуйтеся сталого порядку дій: вступ, два тематичні речення, два розгорнуті основні абзаци, потім висновок.
- Напишіть вступ.
Зазвичай для цього абзацу вам знадобляться два речення. Перефразуйте запитання своїми словами, використовуючи синоніми. Так ваше есе не відійде від теми, а ви зможете показати широкий словниковий запас. Друге речення представляє конкретні теми, які ви розглянете в основних абзацах. Отже, ваш вступ має містити:
- Перефразоване запитання
- Представлення конкретних тем
- Напишіть два тематичні речення. Напишіть по одному тематичному реченню для кожного основного абзацу.
- Розгорніть основні абзаци. Підтвердьте кожен основний абзац двома пунктами й дайте кожному пункту пояснення та приклад. Кожен основний абзац має містити приблизно 4–5 речень.
- Напишіть висновок. Підсумуйте головні думки, а потім скажіть, чому ця тема важлива.
- Перегляньте своє готове есе. Прочитайте всі частини разом і перевірте, що ви відповіли на кожну частину запитання.
Два розгорнуті абзаци отримують вищу оцінку, ніж чотири нерозгорнуті пункти. Екзаменатори винагороджують аргументацію, тож краще додайте пояснення й приклад до пункту, який у вас уже є, ніж ще один пункт.
Вступ
Зазвичай для цього абзацу вам знадобляться два речення. Перефразуйте запитання своїми словами, використовуючи синоніми. Так ваше есе не відійде від теми, а ви зможете показати широкий словниковий запас. Друге речення представляє конкретні теми, які ви розглянете в основних абзацах. Отже, ваш вступ має містити:
- Перефразоване запитання
- Представлення конкретних тем
Тематичні речення
Напишіть по одному тематичному реченню для кожного основного абзацу. Кожне речення має представити головну думку свого абзацу в 12–20 словах, а приклади залиште для наступного етапу.
Аргументація
Тематичне речення приносить бали, коли воно підкріплене аргументами. Поясніть, чому думка правильна, наведіть конкретний приклад і дайте обом основним абзацам однаковий обсяг аргументації. Кожен основний абзац має містити приблизно 4–5 речень.
Висновок
Висновок підсумовує головні думки у двох реченнях, а потім додає одне-два речення про те, чому ця тема важлива. Не копіюйте вступ і не додавайте нового аргументу.
Зразки IELTS Writing та стратегії для IELTS Writing Task 2
Загалом, є 4 кроки до підходу до IELTS Writing Task 2:
1. Прочитайте та зрозумійте - Хоча цей крок може здатися самоочевидним, багато тих, хто складає тест, дозволяють своїм нервам взяти гору і не повністю розуміють запитання. Ось чому перше, що вам потрібно буде зробити під час Writing Task 2 — це повністю зрозуміти запитання та підкреслити ключові слова. Крім того, подумайте про ці дві речі:
- Який тип есе мені потрібно буде написати? (Наприклад, це може бути Problem and Solution).
- Наскільки я знайомий із цією темою? (Це запитання важливе, оскільки воно може вплинути на структуру, яку ви оберете для використання.
2. Сплануйте свою структуру - Тепер, коли ви зрозуміли, що запитує запитання, а також який тип есе вам потрібно буде написати, ви готові накреслити свою структуру. Не пропускайте цей крок. Це повинно зайняти лише 2 або 3 хвилини і служитиме для вас довідником у подальшому. Також, залежно від того, як задається запитання, структура буде різною. Щоб навчитися аналізувати запитання та планувати структуру для кожного типу есе, ознайомтеся з нашими уроками IELTS writing task 2
3. Зробіть нотатки структури - Тепер, коли ви обрали та накреслили свою структуру, зробіть нотатки у своїй структурі, використовуючи ключові слова основних речень кожного абзацу. Це допоможе вам "накреслити" своє есе та дасть вам огляд того, як воно виглядатиме. На цьому етапі ви вже повинні бути в змозі зрозуміти основні теми кожного абзацу.4. Почніть писати - Після планування вашої структури, почніть писати зі вступу та продовжуйте звідти. Обов'язково використовуйте формальний тон (не використовуйте скорочення, виписуйте числа менше 10 тощо) та робіть відступ після кожного абзацу.
Наступні дописи блогу навчать вас, як справлятися з кожним типом запитання, і містять понад 100 запитань IELTS writing task 2 та зразків есе. Не соромтеся використовувати їх для своєї підготовки до IELTS.
- How to Answer Opinion Question Types in IELTS Writing Task 2
- How to Answer Discussion Question Types in IELTS Writing Task 2
- How to Answer Advantage & Disadvantage Question Types in IELTS Writing Task 2
- How to Answer Problem and Solution Question Types in IELTS Writing Task 2
- How to Answer Answer Cause and Effect Question Types in IELTS Writing Task 2
- How to Answer Two-part Question Types in IELTS Writing Task 2