
本ガイドでは、IELTSライティングTask 1とIELTSライティングTask 2でハイスコアのエッセイを書く方法を学べます。アカデミック・ジェネラルトレーニングのどちらの試験でも対応可能です。本ガイドには、ジェネラルライティングTask 1・2、アカデミックライティングTask 1・2向けのIELTSライティングサンプル、トピック、詳細なレッスンが含まれています。
下のリンクをクリックすると、無料のIELTSライティング模擬テストを受けることができ、模範解答を受け取れます。
| IELTS Generalライティングテスト | IELTS Academicライティングテスト |
|---|---|
以下はIELTSライティング問題と模範解答の全リストです。いつでも無料で練習できます。
IELTS Generalライティング Task 1 サンプル 1 - 44
Informal, formal, & semi-formal letters
IELTS Academicライティング Task 1 サンプル 1 - 52
Line graphs, bar charts, pie charts, tables, maps, flow charts, & multiple charts
IELTSライティング Task 2 サンプル 1 - 96
Opinion, discussion, advantages & disadvantages, problem & solution, cause & effect, & two-part questions
目次
IELTSライティングテスト情報
ライティングテストは2つのライティング課題で構成されており、両方を完了するための合計時間は60分です。 どちらの順序で完了しても構いませんが、時間配分をしっかり行い、 IELTSライティングTask 1には約20分、IELTSライティングTask 2には約40分を使うようにしてください。
IELTSアカデミックライティングTask VS IELTSジェネラルライティングTask
IELTSには2種類の試験バージョンがあります。アカデミックバージョンは高等教育を目指す方のためのもので、 ジェネラルトレーニングバージョンは単に移住を希望する方や、より低い教育レベルを目指す方のためのものです。両バージョンにはさらに多くの基準があるため、ご自身に合った試験を知るためにIELTSのカスタマーサービスにお問い合わせください。
では、どちらの試験がより難しいでしょうか? ご想像のとおり、アカデミックテストの方がジェネラルトレーニングテストよりも難しいです。両者の違いはIELTSライティングTask 1の難易度にあります。幸いなことに、異なるのはライティングTask 1だけです。 IELTSライティングTask 2は両方の試験バージョンで同じです。 以下の表は、2種類のIELTSライティング試験をまとめたものです。
| 試験の種類 | Task 1 | Task 2 |
|---|---|---|
| アカデミックライティング | IELTSアカデミックライティングTask 1
IELTSアカデミックライティングTask 1では、グラフ、表、チャート、または図が提示され、その情報を自分の言葉で説明、要約、または解釈するよう求められます。 |
IELTSライティングTask 2 IELTSライティングTask 2では、質問に答える形で従来型のスタイルのエッセイを書く必要があります。少なくとも250語を書く必要があります。 |
| ジェネラルライティング |
IELTSジェネラルライティングTask 1
IELTSジェネラルライティングTask 1では、与えられた状況に関する手紙を書くよう求められます。この手紙は以下のいずれかのタイプになります。 - フォーマル(フォーマルな手紙は、知らない人または会ったことのない人に送ります。) - セミフォーマル(セミフォーマルな手紙は、よく知らない人に送ります。) - インフォーマル(インフォーマルな手紙は、友人など、よく知っている人に送ります。) |
IELTSアカデミックライティングTask概要動画
IELTSジェネラルライティングTask概要動画
近日公開予定!
IELTSライティングテストの採点方法
IELTSライティングテストでは、ライティングのスコアは4つのカテゴリーに基づいて採点されます。これらは
Task Achievement/Task Response、Coherence and Cohesion、Lexical Resource、Grammatical Range and Accuracyとして知られています。
試験のライティング部分を採点するためにIELTS試験官が使用する以下のバンド記述子を参照してください。
- IELTSライティングTask 1バンド記述子
- IELTSライティングTask 2バンド記述子
両方の課題の採点基準は以下を含みます。
- Task Achievement/Task Response - 質問に完全に答え、十分に発展した回答を提示できましたか?
- Coherence and Cohesion - あなたの論証や分析は意味が通っていますか?よく考えられ、完全な形で提示されていますか?
- Lexical Resource – 自然でフォーマルな調子で幅広い語彙を使用しましたか?
- Grammatical Range and Accuracy – あなたのエッセイは事実上エラーがありませんか?幅広い文法構造を使用できましたか?
IELTSライティングTask 1とIELTSライティングTask 2は同じ配点ですか?
IELTSライティングTask 2を書くのに2倍の時間をかけるのと同じように、
配点も約2倍になります。ただし、正確に2倍というわけではありません。
別の見方をすれば、ライティングTask 2のスコアを2回足すことです。つまり、
Task 1のバンドスコアが7、Task 2のバンドスコアが4の場合、
IELTSライティングスコアの計算方法は以下の式になります。
(7 + (4 x 2))/3 = 5。
したがって、IELTSライティングの総合バンドスコアは約4.5〜6になります。IELTSはその採点式を公表していないため正確な数値を示すことはできませんが、
ここで示した式は約0.5ポイントの差まではかなり正確です。
採点済みのIELTSエッセイ19,000本からわかること
2020年から2026年にかけて、BestMyTestの講師は約9,400件のIELTSライティング課題を採点し、AIレビューはさらに9,614本のエッセイを添削しました。そこから3つの特徴が浮かび上がります。
- 文法がバンドスコアを左右します。 文法の幅と正確さ(Grammatical Range and Accuracy)は、Task 2のエッセイの91%、アカデミックTask 1のレポートの84%、ジェネラル・トレーニングの手紙の94%で、4つの評価基準のうち最も低いスコアでした。Task 2の講師による平均スコアは、文法5.5、語彙力(Lexical Resource)6.0、一貫性と結束性(Coherence and Cohesion)6.1、設問への対応(Task Response)6.1でした。アカデミックTask 1では、文法5.5、一貫性5.8、課題達成度(Task Achievement)5.8、語彙力5.8でした。ジェネラル・トレーニングTask 1では、文法5.3、語彙力5.9、一貫性6.0、課題達成度6.2でした。
- 短いエッセイは減点されます。 Task 2のエッセイの17%は最低語数の250語に届かず、設問への対応の平均スコアは4.9で、250語に達したエッセイの6.1を下回りました。アカデミックTask 1のレポートの13%とジェネラル・トレーニングの手紙の16%は、150語未満でした。当サイトの学習者の平均語数は、Task 2で285語、Task 1で約175語です。
- 間違いは小さく、繰り返し現れます。 Task 2のエッセイ1本につき、約21か所の修正が入ります。最も多いのは句読点(修正の17%)で、次いで冠詞(11%)、スペル(10%)、名詞の単数形と複数形(9%)、主語と動詞の一致(7%)、前置詞(6%)です。Task 2のエッセイの3分の2に冠詞の誤りがあり、58%に主語と動詞の一致の誤りがありました。アカデミックTask 1では、データを表す語彙でもミスが生じます:"male" から "males"、"increase" から "increased"、"compare" から "compared"。ジェネラル・トレーニングの手紙では、大文字の使い方(修正の9%)と動詞の時制(6%)が、他の課題よりも重要になります。
- 当サイトのレビューで特によく行われる修正: "this" から "these"、"is" から "are"、"have" から "has"、"in" から "on"、"of" から "for"、"amount" から "number"、"then" から "than"、"that" から "who"、"goverment" から "government"、"belive" から "believe"、"accomodation" から "accommodation"。
数値は、2026年10月までのBestMyTestの模擬試験およびレビューのデータに基づいています。問題形式別の割合は全解答における正答率を示し、評価基準別の数値は、記載のとおり講師またはAIによるスコアを示しています。最終更新日:2026年10月5日。
IELTSアカデミックライティングTask 1
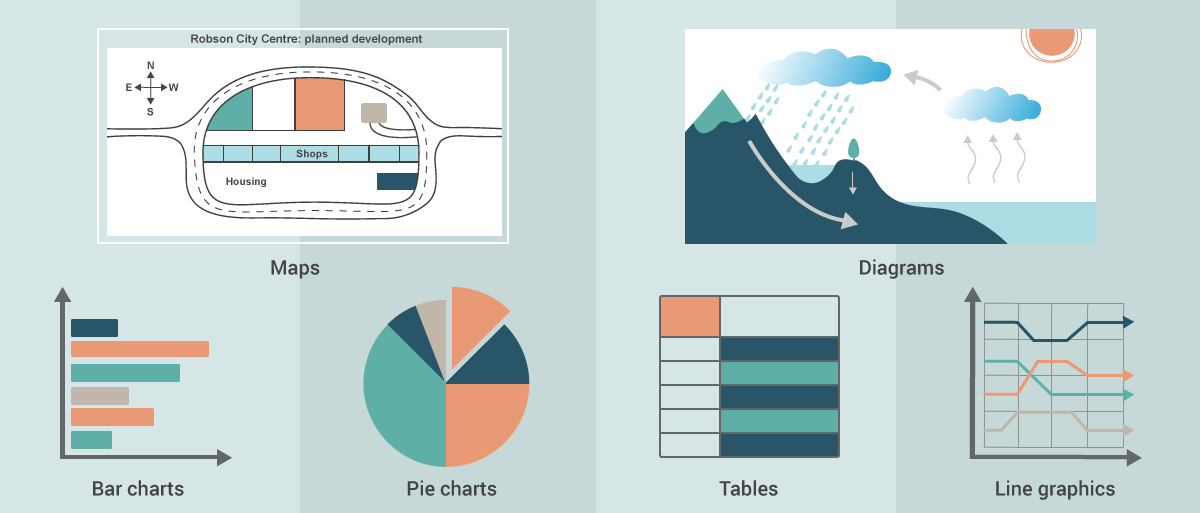
IELTSアカデミックライティングTask 1では、グラフ、表、チャート、または図が提示され、その情報を自分の言葉で説明、要約、または解釈するよう求められます。データを説明・解釈したり、プロセスの段階や何かの仕組みを説明したり、物事や出来事を説明するよう求められる場合があります。
どのような視覚情報が提示されたとしても、あなたの仕事は視覚情報の要約を書き、 主な傾向、全体的な違い、主な変化、システムの主な構成要素、 またはプロセスの主な段階を説明することです。少なくとも150語以上を書く必要があり、このパートには約20分を使うべきです。 ライティングの構成は以下のようになります。
- 導入: 質問を言い換える
- 概要: 全体的な傾向を説明するか、主なグループ分けの一般的な概要を書く
- 本文段落1: 最初のグループ分けについて論理的に詳細を書く
- 本文段落2: 2番目のグループ分けについて論理的に詳細を書く
つまり、この課題のレポートを書く手順は非常にシンプルです。
- チャートを分析し、情報のグループ分けを計画する
- 推奨されるエッセイ構成を使ってエッセイを書く
- エッセイを校正する
IELTSライティングテストで遭遇する可能性のある視覚的グラフ、表、チャート、図の各タイプを見てみましょう。
折れ線グラフ
このタイプの課題では、1つまたは複数の折れ線グラフが与えられます。各折れ線グラフには1〜8本の線があり、 時間の経過に伴う値の変化を示しています。 期間は過去、現在、未来、またはこれら3つすべての組み合わせである可能性があります。あなたの仕事は最も重要なポイントをカバーする要約を書き、 データを含めて説明を裏付けることです。
The chart illustrates average CO2 emissions per person in four European countries between 1975 and 2015.
Summarise the information by selecting and reporting the main features, and make comparisons where relevant.
- Write at least 150 words.
- You should spend around 20 minutes on this task.
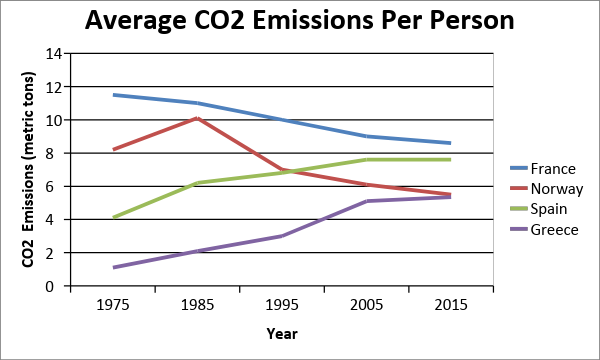
The line graph depicts the average Carbon dioxide emission for each individual residing in four countries, namely France, Norway, Spain, and Greece, over 40 years.
Overall, although CO2 production in France and Norway declined, it increased significantly in Spain and Greece over the period. Norway improved the most to become the most environmentally friendly, whereas Greece had the highest increase of all in that time.
Throughout the period, France produced the most CO2, though production declined overall from 11 tonnes per individual in 1975 to around 8.5 tonnes by 2015. In turn, except for a spike in emissions in 1985, Norway’s production of CO2 fell from 8 to under 6 tonnes forty years later.
On the contrary, CO2 release in Spain and Greece saw a more upward turn. In Spain, production doubled from 4 tonnes in 1975, overtaking Norway by 1995, to a final figure of just under 8 metric tonnes per head of population. Similarly, emissions in Greece, which were the lowest in 1975, increased five times to equal those of Norway in 2015.

Line Chart
Learn how to answer this question in a step-by-step interactive exercise
Line Chart
IELTS アカデミックのタスク1では、グラフが示している内容を説明します。意見を述べたり、数値がなぜそうなっているかを説明したりはしません。
折れ線グラフは、値が時間とともにどう変化するかを、多くの場合は複数の線で同時に示します。そのため、このレポートでは変化を説明し、線どうしを比較します。
課題を確認したら、「次へ」をクリックして進んでください。
設問を確認する
Summarise the information by selecting and reporting the main features, and make comparisons where relevant.
Write at least 150 words.
書く前にグラフを読み取りましょう。タイトル、横軸の期間、縦軸の単位、そして各線の名前を示す凡例を確認します。
次に、実測データが終わり、予測が始まる地点を見つけましょう。その地点で時制が分かれます。すでに測定された年には過去形を、これから先の年には is expected to、is predicted to、is set to などの形を使います。
グラフについての質問に答えてください。
グラフを読む
序論では、グラフが示している内容を自分の言葉で述べます。課題文を言い換えましょう。表現は変えても意味は保ち、話題、線が何を測っているか、期間は残します。
課題文をそのまま写しても評価されません。また、数値はここには書きません。数値はすべて本論の段落のためにとっておきましょう。
課題文を言い換えた文を1〜2文書いてください。
序論を書く
課題の問い
The chart illustrates average CO2 emissions per person in four European countries between 1975 and 2015.
Summarise the information by selecting and reporting the main features, and make comparisons where relevant.
Write at least 150 words.
タスク1のレポートには線のグループごとに本論の段落が1つ必要です。折れ線グラフでは、たいてい線の数がグループの数より多くなります。同じ方向に動く線をまとめましょう。上昇する線、下降する線、横ばいの線です。すべての線が同じ方向に動くなら段落は1つ、3種類が1本ずつあるなら段落は3つになります。
線ごとに段落を作ったり、期間を前半と後半に分けて段落を作ったりすると、課題が求めている比較が崩れてしまいます。水準だけでグループ分けすると、上昇する線と下降する線が同じ段落に入ってしまうことがあります。
各段落に明確なパターンが1つずつ入るグループ分けを選んでください。
グループに分ける
各段落に明確なパターンが1つずつ入るグループ分けを選んでください。
- Group 1: Norway, Spain, Greece. Group 2: France.
- Group 1: Greece. Group 2: France, Norway, Spain.
- Group 1: Norway, Greece. Group 2: France, Spain.
- Group 1: France, Norway. Group 2: Spain, Greece.
概要とは、グラフ全体の中で最も大きなパターンのことです。主な特徴がそれを形づくります。まず:期間全体を通じて、各グループは全体としてどの方向に動いているでしょうか。次に:グループが2つ以上ある場合、最上位と最下位のグループはどのくらい離れているでしょうか。その差は広がる、縮まる、入れ替わるのどれでしょうか。
これらの特徴をまとめれば概要になります。ここに個々の年や数値は加えないでください。それらは本論の段落のためにとっておきましょう。
主な特徴を見つけて、概要を組み立ててください。
全体の傾向を見つける
次に、2つの主な特徴を1〜2文にまとめましょう。概要は試験官が最初に探す部分なので、細部より先に書き、全体的な内容にとどめます。
時制をグラフに合わせ、なぜそうなっているかではなく、何を示しているかを説明します。数値は書かず、意見も加えないでください。
最も大きなパターンについて、全体的な文を1〜2文書いてください。
概要を書く
本論の第1段落では、1つ目の線のグループだけを期間全体にわたって扱います。数値を書くのはここです。
線上のすべての点ではなく、各線の形を説明しましょう。始まりの値、方向、方向の変化、そして最後の値や予測値です。rise steadily、fluctuate、level off、peak のような時間による変化を表す表現を使い、それぞれの数値には年を添えましょう。
あるポイントの表現に迷ったら、そのポイントをクリックすると、例文が入力欄に追加されます。
1つ目のグループについて、数値を入れて3〜4文書いてください。
本論の段落1を書く
本論の第2段落では、2つ目の線のグループだけを扱います。同じように、各線の形を数値で裏付けて書きましょう。
本論の第1段落の内容を繰り返さないでください。取り上げる価値のある違いがあれば、in contrast や far lower than などの表現を使ってグループどうしを結びつけましょう。
あるポイントの表現に迷ったら、そのポイントをクリックすると、例文が入力欄に追加されます。
2つ目のグループについて、数値を入れて3〜4文書いてください。
本論の段落2を書く
レポートの構成が完成しました。完成したタスク1の解答は、次の順序で構成されます。課題文を言い換えた序論、最も大きなパターンを示す概要、そしてそのパターンを選んだ数値で裏付ける、グループごとの本論の段落です。
各セクションを通して読み、次の3点を確認しましょう。概要と詳細が一致しているか、時制が実測値と予測値に合っているか、すべての数値に単位と年がついているか。
レポートの構成を見直し、模範解答と比べてください。
レポート全体の計画
決め方
IELTS アカデミック タスク1の折れ線グラフは、値が時間とともにどう変化するかを、多くの場合複数の線で同時に示します。その変化を説明し、線どうしを比べます。すべての線のすべての点は必要ありません。
最初の1文を書く前にレポートの計画が立っているように、決まった順番で進めましょう。
- グラフを読む. タイトル、期間、単位、凡例を確認し、実測データがどこで終わり、予測がどこから始まるかも確認しましょう。
- 序論を書く. 課題文を言い換え、グラフが何を示しているかを書きましょう。
- グループに分ける. 同じような動きをする線をまとめ、本論の各段落が1つのはっきりした内容を持つようにしましょう。
- 全体の傾向を見つける. 個々の値を見る前に、グラフ全体でいちばん大きなパターンを決めましょう。
- レポートを段階的に書く. まず概要を書き、次にグループごとに選んだ数値を使って本論の段落を1つずつ書き、最後に計画全体を見直しましょう。
線を説明する前に、線をグループに分けましょう。線がたくさんあるグラフでも、似た線を1つの段落にまとめれば短いレポートになります。グループ分けこそが、課題の言う「主な特徴を選ぶ」ということです。
グラフを読む
まず軸を見ましょう。横軸は期間、縦軸は単位を示し、凡例は各線の名前を示しています。実測データが終わる点を見つけましょう。そのあとはすべて予測なので、未来を表す形が必要です。
序論
序論は1〜2文で、グラフが何を示しているかを課題文とは違う言葉で述べます。話題、線が測っているもの、期間は残しましょう。数値や傾向は書きません。
グループ
タスク1のレポートでは、線のグループごとに本論の段落を1つ書きます。同じ方向に動く線をまとめましょう。上昇する線、下降する線、横ばいの線です。すべての線が同じ動きなら段落は1つ、3種類が1本ずつなら段落は3つになります。
全体の傾向
全体の傾向とは、グラフの中でいちばん大きなパターンのことです。期間全体での各グループの大まかな方向と、グループどうしの差がどのくらいあるかです。これは全体についての記述なので、数値は入れません。
IELTSアカデミックライティングTask 1の折れ線グラフへの取り組み方を学ぶには、IELTSアカデミックライティングTask - 折れ線グラフレッスンをご覧ください。
7日間無料体験棒グラフ
このタイプの課題では、1つまたは複数の棒グラフが与えられます。棒グラフは 時間の経過に伴う値の変化(動的データ)、ある時点での値の違い(静的データ)、 または調査やアンケートの結果を示している可能性があります。 情報は過去、現在、未来の状況、またはこれら3つすべての組み合わせに関するものである可能性があります。 あなたの仕事は、最も重要なポイントをカバーする要約を書き、データを含めて説明を裏付けることです。
The chart below shows the proportion of males and females in Malaysia who commonly do physical activity in 2010.
Summarise the information by selecting and reporting the main features, and make comparisons where necessary.
- Write at least 150 words.
- You should spend around 20 minutes on this task.
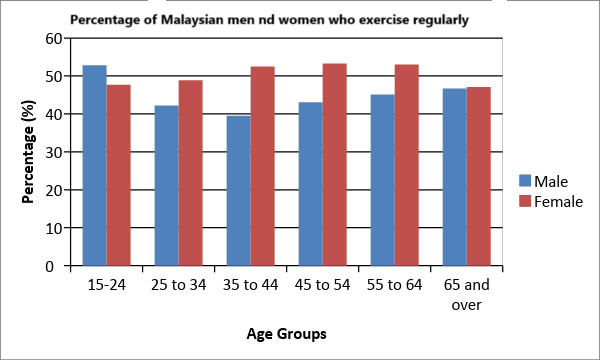
The bar chart compares the proportion of male and females of differing age groups who frequently undertook physical activity in 2010.
Overall, while the Malaysian population keeps fit in general, a higher proportion of women than men exercised in 2010, with some further differences between age groups. Middle-aged females were the most likely to work out, while for men, those aged 15 to 24 tended to do the most physical activity.
In terms of men’s exercise habits, younger men were much more likely to exercise than older men with 52.8% of those aged under 24 exercising as opposed to only around 40% of older age groups
By contrast, around half of all women in all age groups reported keeping fit, especially those aged between 35 and 64 at around 53%. The exception was the youngest age group in which only 47.7 percent of women exercised compared to 52.8% of men. Similarly, for people 65 and over, just approximately 47% of both sexes were recorded regularly working out.
Bar Chart
Learn how to answer this question in a step-by-step interactive exercise
Bar Chart
IELTS アカデミックのタスク1では、グラフが示している内容を説明します。意見を述べたり、数値がなぜそうなっているかを説明したりはしません。
棒グラフは、いくつかの項目にわたってグループどうしを比較するものです。そのため、このレポートは時間による変化ではなく、比較を中心に組み立てます。
課題を確認したら、「次へ」をクリックして進んでください。
設問を確認する
Summarise the information by selecting and reporting the main features, and make comparisons where necessary.
Write at least 150 words
書く前にグラフを読み取りましょう。タイトル、横軸の項目、縦軸の単位、そして棒の各グループの名前を示す凡例を確認します。
単位によって表現が決まります。人数、割合、金額はそれぞれ別のものです。単位を間違えると、文の他の部分が正しくても減点されます。
グラフについての質問に答えてください。
グラフを読む
序論では、グラフが示している内容を自分の言葉で述べます。課題文を言い換えましょう。表現は変えても意味は保ち、話題、比較されているグループ、そして課題に場所や時期が示されていればそれも残します。
課題文をそのまま写しても評価されません。また、数値はここには書きません。数値はすべて本論の段落のためにとっておきましょう。
課題文を言い換えた文を1〜2文書いてください。
序論を書く
課題の問い
The chart below shows the proportion of males and females in Malaysia who commonly do physical activity in 2010.
Summarise the information by selecting and reporting the main features, and make comparisons where necessary.
Write at least 150 words
タスク1のレポートにはグループごとに本論の段落が1つ必要なので、データの分け方を早めに決めましょう。凡例にある系列のうち、似た動きをするものをまとめます。同じくらいの水準にある系列や、同じ項目で高くなったり低くなったりする系列は、同じ段落に入れます。違う動きをする系列には、別の段落を立てます。こうすると、各段落に明確な考えが1つずつ入ります。
高い値と低い値を分けるだけの分け方や、項目ごとに段落を作る分け方では、同じことを繰り返すことになります。
各段落に明確な考えが1つずつ入るグループ分けを選んでください。
グループに分ける
各段落に明確な考えが1つずつ入るグループ分けを選んでください。
- Group 1: Female. Group 2: Male.
- One group: Male and Female.
概要とは、グラフ全体の中で最も大きなパターンのことです。最大3つの主な特徴で構成されます。ほとんどの項目で高いのはどのグループでしょうか。ほとんどの項目で最も低いのはどのグループでしょうか。差はどの項目でもほぼ同じでしょうか、それとも1つの項目だけが他と大きく違うでしょうか。
すべてのグラフに3つとも見られるわけではないので、このステップではこのグラフにとって重要な特徴だけを尋ねます。それらをまとめれば概要になります。ここに個々の数値は加えないでください。数値は本論の段落のためにとっておきましょう。
主な特徴を見つけて、概要を組み立ててください。
全体の傾向を見つける
次に、見つけた主な特徴を1〜2文にまとめましょう。概要は試験官が最初に探す部分なので、細部より先に書き、全体的な内容にとどめます。
グラフがなぜそうなっているかではなく、何を示しているかを説明します。数値は書かず、意見も加えないでください。
最も大きなパターンについて、全体的な文を1〜2文書いてください。
概要を書く
本論の第1段落では1つ目のグループだけを扱います。数値を書くのはここです。
重要な比較を選びましょう。最も高い値、最も低い値、そして他と違う動きをする項目です。棒グラフは同じ時期のグループを比較するものなので、higher than、twice as many as、the largest of all the categories のような比較の表現を使いましょう。
あるポイントの表現に迷ったら、そのポイントをクリックすると、例文が入力欄に追加されます。
1つ目のグループについて、数値を入れて3〜4文書いてください。
本論の段落1を書く
本論の第2段落では2つ目のグループだけを扱います。1つ目と同じように、最もはっきりした比較を数値で裏付けて書きましょう。
本論の第1段落の内容を繰り返さないでください。取り上げる価値のある違いがあれば、in contrast や compared with などの表現を使ってグループどうしを結びつけましょう。
あるポイントの表現に迷ったら、そのポイントをクリックすると、例文が入力欄に追加されます。
2つ目のグループについて、数値を入れて3〜4文書いてください。
本論の段落2を書く
レポートの構成が完成しました。完成したタスク1の解答は、次の順序で構成されます。課題文を言い換えた序論、最も大きなパターンを示す概要、そしてそのパターンを選んだ数値で裏付ける、グループごとの本論の段落です。
各セクションを通して読み、次の3点を確認しましょう。概要と詳細が一致しているか、すべての数値に単位がついているか、理由を説明せずにグラフの内容を描写しているか。
レポートの構成を見直し、模範解答と比べてください。
レポート全体の計画
決め方
IELTS アカデミック タスク1の棒グラフでは、グラフが何を示しているかを説明し、グラフの中のグループを比べることが求められます。すべての数値は必要ありません。必要なのは、重要な比較です。
最初の1文を書く前にレポートの計画が立っているように、決まった順番で進めましょう。
- グラフを読む. 何かを書く前に、タイトル、カテゴリー、単位、凡例を確認しましょう。
- 序論を書く. 課題文を言い換え、グラフが何を示しているかを書きましょう。
- グループに分ける. 本論の各段落が1つのはっきりした内容を持つように、データを分けましょう。
- 全体の傾向を見つける. 個々の値を見る前に、グラフ全体でいちばん大きなパターンを決めましょう。
- レポートを段階的に書く. まず概要を書き、次にグループごとに選んだ数値を使って本論の段落を1つずつ書き、最後に計画全体を見直しましょう。
わかりやすい概要は、数値を増やすことより価値があります。課題は主な特徴を選ぶことを求めているので、すべての値を並べるより、全体についての記述と、いくつかの効果的な比較のほうが高く評価されます。
グラフを読む
まず軸を見ましょう。横軸は何を比べているかを、縦軸は単位を示し、凡例は棒の各グループの名前を示しています。単位を間違えたレポートは、すべての文の意味が変わってしまいます。
序論
序論は1〜2文で、グラフが何を示しているかを課題文とは違う言葉で述べます。話題、比べているグループ、場所や時期は残しましょう。数値や傾向は書きません。
グループ
タスク1のレポートでは、グループごとに本論の段落を1つ書きます。凡例にある系列のうち、同じような動きをするものをまとめましょう。同じくらいの水準にある系列や、同じカテゴリーで高くなったり低くなったりする系列です。そうすれば、各段落が1つの内容を持ち、同じことを繰り返さずに済みます。
全体の傾向
全体の傾向とは、グラフの中でいちばん大きなパターンのことです。ほとんどのカテゴリーでどのグループが高いか、ほとんどのカテゴリーでどのグループが最も低いか、そして差がどのカテゴリーでもほぼ同じか、あるカテゴリーだけ大きく違うかです。グラフによって、このうち1つ、2つ、または3つすべてが見られます。これは全体についての記述なので、数値は入れません。
棒グラフはIELTSライティングTask 1アカデミックでかなり一般的です。棒グラフの課題で遭遇する3つの異なるシナリオがあります。
- x軸にカテゴリーがある棒グラフ
- 軸に日付や年がある棒グラフ(折れ線グラフとして機能)
- 2つの棒グラフが提示される
各シナリオは、レポートを異なる方法で書くことを要求します。7日間の無料体験にサインアップして、以下の棒グラフレッスンにアクセスしてください。
- IELTSアカデミックライティングTask - 棒グラフPart 1レッスン。
- IELTSアカデミックライティングTask - 棒グラフPart 2レッスン。
- IELTSアカデミックライティングTask - 棒グラフPart 3レッスン。
円グラフ
このタイプの課題では、1つ、2つ、または3つの円グラフが与えられます。円グラフは 合計値のパーセンテージを示すことがあります。1つの円グラフがある場合は、 ある時点(静的データ)を表します。2つ以上の円グラフがある場合は、 パーセンテージが時間とともにどのように変化するか、または異なる国やグループを比較することを表す可能性があります。 あなたの仕事は、最も重要なポイントをカバーする要約を書き、データを含めて説明を裏付けることです。
The charts below show the percentage of water used for different purposes in six areas of the world. Summarise the information by selecting and reporting the main features, and make comparisons where relevant.
- Write at least 150 words.
- You should spend around 20 minutes on this task.
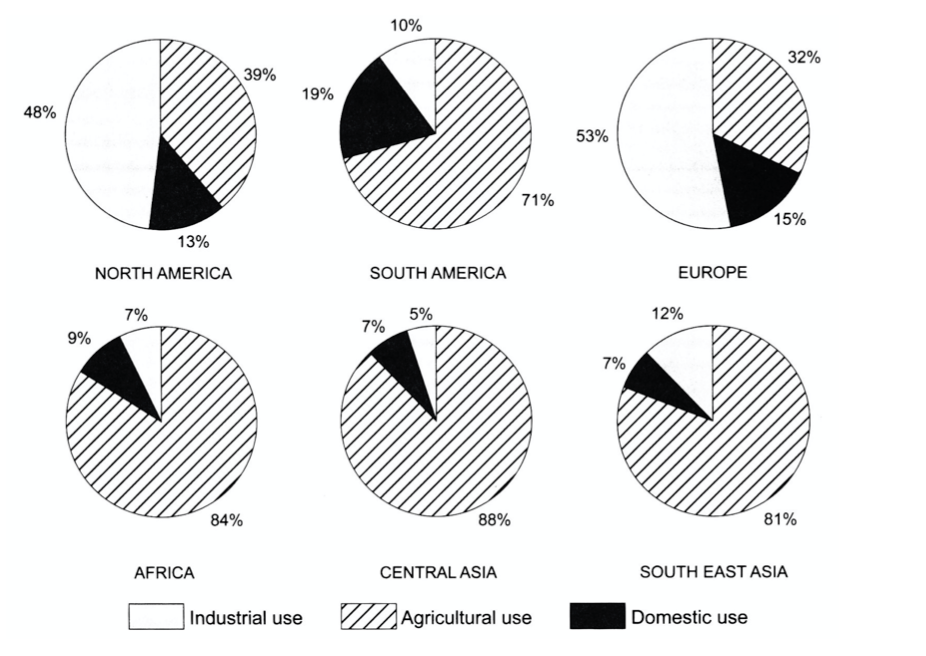
The pie charts provide information regarding the proportions of water used for industrial, agriculture, and domestic use in six regions.
In general, water serves mostly an industrial purpose in North America and Europe, whereas it is predominantly used for agriculture in South America, Africa, Central Asia, and South-East Asia.
Regarding industrial and domestic use, North America and Europe consume an average of approximately 50 percent of water for industrial purposes. However, these two regions report much less water consumption for domestic purposes, utilizing 13 percent and 15 percent, respectively. Out of all six regions, South America dedicates the highest percentage of water consumption for domestic use, but uses only 10 percent for industrial reasons. Both industrial and domestic use remain the least popular choices in Africa, Central Asia, and South-East Asia, where their combined use makes up less than 20 percent of the overall water consumption in each of the three regions.
Agricultural use, on the other hand, accounts for 71 percent of water consumption in South America and over three-fourths of water use in Africa, South-East Asia, and Central Asia, where it is nearly 90 percent. North America and Europe consume less than 40 percent of water for agricultural purposes.
IELTSアカデミックライティングTask 1の円グラフへの取り組み方を学ぶには、7日間の無料体験にサインアップして、IELTSアカデミックライティングTask - 円グラフレッスンにアクセスしてください。
7日間無料体験表
このタイプの課題では、データを含む表が与えられます。 時間とともに変化する動的な数値、またはある時点の静的なデータを示すことができます。 多くの場合、情報が多すぎるため、すべての詳細を含めることはできません。 あなたの仕事は、最も重要なポイントをカバーする要約を書き、データを含めて説明を裏付けることです。
The table below gives the average time spent and distance traveled by UK commuters in one year. Time and distance are given in minutes and miles accordingly.
Summarise the information by selecting and reporting the main features, and make comparisons where relevant.
Commuting Habits of different regions of the UK in a year
UK Region | Average Commuting Time (minutes) | Average Commuting Distance (miles) |
London | 54 | 14 |
South East | 78 | 20 |
Scotland | 45 | 19 |
West Midlands | 39 | 18 |
North West | 36 | 18 |
Northern Ireland | 36 | 15 |
Yorkshire & Humberside | 36 | 14 |
South West | 34 | 16 |
East Anglia | 33 | 15 |
North East | 32 | 19 |
East Midlands | 32 | 15 |
Wales | 27 | 14 |
- Write at least 150 words.
- You should spend around 20 minutes on this task.
The table shows data on the average commuting time (minutes) and distance (miles) completed by UK citizens in 12 different regions in one year.
Overall, with the exception of London, the further people travel, the more time they need to reach work people. Commuters in the south east region spend the longest time commuting over the greatest distance, whereas people in Wales spend the least.
Regarding the top three UK regions, on average, people in the south east travel both the farthest and longest at 20 miles over 78 minutes. Likewise inhabitants of Scotland journey a similar distance to work, yet spend almost half the time doing so at 45 minutes to get there, while those living in London spend the second-longest time travelling (54 minutes) over just 14 miles.
Of the other regions, people in the West Midlands spent the most time travelling at 39 minutes whereas those in Wales recorded the lowest time at 27 minutes. With regard to distance, residents of the North East, West Midlands and North West recorded the greatest mileage at 19, 18 and 18 miles respectively, while people in Yorkshire and Humberside as well as Wales both travelled the shortest distance to work of all at 14 miles.
IELTSアカデミックライティングTask 1の表への取り組み方を学ぶには、7日間の無料体験にサインアップして、以下のレッスンにアクセスしてください。
- IELTSアカデミックライティングTask - 表Part 1レッスン。
- IELTSアカデミックライティングTask - 表Part 2レッスン。
プロセス図
このタイプの質問では、何かがどのように機能するかを示す図が与えられます。
図には機械、システム、または自然現象が示されている可能性があります。
多くの場合、データはまったく含まれていないか、含まれていても少しだけです。
あなたの仕事は図に示されている情報を要約することです。
The diagram below shows the water cycle, which is the continuous movement of water on, above and below the surface of the Earth.
Summarise the information by selecting and reporting the main features.
- Write at least 150 words.
- You should spend around 20 minutes on this task.
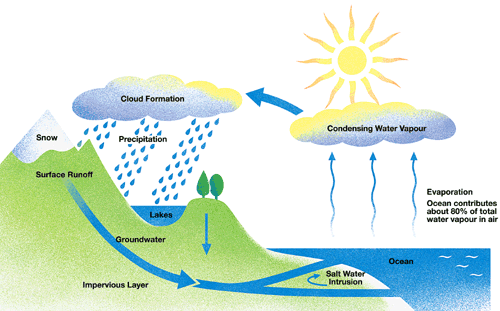
The diagram illustrates the hydrological cycle by which water moves through our natural environment. Overall, there are several stages to the process involving evaporation, precipitation and the final return of water to the ocean where the process begins over.
Since 80% of all water begins in the ocean, most water originates from this source. Initially sea water is warmed by the sun, causing it to evaporate into the air becoming water vapor. This then rises to condense into clouds at a higher elevation, which are then then pushed by the wind over land where it condenses further and precipitation occurs, falling as either snow or rain.
After precipitation on land, water then takes one of three routes. Some of it may fall into lakes or return to the ocean as surface runoff. Still further water percolates underground to an impermeable layer where it again flows back to the sea. Salt water also intrudes from the ocean into the land in coastal areas.

Process Diagram
Learn how to answer this question in a step-by-step interactive exercise
Process Diagram
IELTS アカデミックのタスク1のプロセス図問題では、ものがどのように作られるか、またはある仕組みがどのように働くかが、段階を追って示されます。図に示された順序どおりに各段階を報告し、理由や意見は述べません。
課題文を確認したら、「次へ」をクリックして進んでください。
設問を確認する
Summarise the information by selecting and reporting the main features.
Write at least 150 words.
何かを書く前に、図をしっかり理解しておきましょう。段階の数を数え、矢印をたどって、プロセスがどこで始まり、どこで終わるかを確認します。最後の矢印が最初の段階に戻っている場合、そのプロセスはサイクル(循環)で、最終製品はありません。
図についての質問に答えてください。
グラフを読む
序論では、図が何を示しているかを読み手に伝えます。課題文をそのまま写さず、自分の言葉で言い換え、そのプロセスの名前を示しましょう。ここでは個々の段階は説明しません。
序論を1〜2文で書いてください。
序論を書く
課題の問い
The diagram below shows the water cycle, which is the continuous movement of water on, above and below the surface of the Earth.
Summarise the information by selecting and reporting the main features.
Write at least 150 words.
IELTS のタスク1のレポートには、段階のグループごとに本論の段落が1つ必要です。段階ごとに段落を作ってはいけません。場所、材料、目的が変わる自然な区切りでプロセスを分け、各グループが連続した段階のまとまりになるようにしましょう。ほとんどのプロセスはグループが2つになります。短いプロセスなら1つ、長いプロセスなら3つになることもあります。
グループを選んでください。
グループに分ける
グループを選んでください。
- Group 1: stages 1 to 2 (Evaporation to Condensing Water Vapour). Group 2: stages 3 to 4 (Cloud Formation to Precipitation). Group 3: stages 5 to 6 (Surface Runoff to Groundwater).
- Group 1: stages 1 to 3 (Evaporation to Cloud Formation). Group 2: stages 4 to 5 (Precipitation to Surface Runoff). Group 3: stage 6 (Groundwater).
- Group 1: stages 1 to 3 (Evaporation to Cloud Formation). Group 2: stages 4 to 6 (Precipitation to Groundwater).
- Group 1: stages 1 to 2 (Evaporation to Condensing Water Vapour). Group 2: stages 3 to 5 (Cloud Formation to Surface Runoff). Group 3: stage 6 (Groundwater).
概要は、プロセス全体をひと目でわかるようにまとめたものです。段階がいくつあるか、始まりから終わりまでの主な段階は何かを考えましょう。プロセスが他の何かと比較されることはほとんどないので、増加や減少を探すのではなく、プロセスの全体像を説明します。
質問に答えて、全体の傾向を見つけてください。
全体の傾向を見つける
前のステップのメモを使いましょう。概要では、段階の数と主な段階を述べ、プロセスが製品で終わるのか、サイクルとして繰り返されるのかを示します。設備、時間、温度は本論の段落のためにとっておき、理由や意見は述べないでください。
概要を1〜2文で書いてください。
概要を書く
本論の第1段落では、1つ目の段階のグループを、矢印が示す順序どおりに一段階ずつ説明します。図には誰が作業をするのかがほとんど示されないので、is heated、is mixed、is poured のような受動態を使いましょう。段階どうしは first、then、after that のような順序を表す語でつなぎます。
本論の第1段落を3〜4文で書いてください。
本論の段落1を書く
本論の第2段落では、2つ目の段階のグループを説明します。本論の第1段落が終わったところから続けるので、流れが途切れることはありません。引き続き受動態を使い、once や after this のような表現でグループどうしをつなぎましょう。これが最後の段落なら、in the final stage や finally で終わりを示します。プロセスがサイクルの場合は、最後の段階が最初の段階に戻ることを書きましょう。
本論の第2段落を3〜4文で書いてください。
本論の段落2を書く
これで各セクションが1つのレポートになりました。序論、概要、そして段階のグループごとの本論の段落です。通して読み、段階が順序どおりに並んでいるか、受動態が正しいか、レポートの長さが十分かを確認しましょう。
レポートの構成全体を読んでから、「次へ」をクリックして模範レポートと比べてください。
レポート全体の計画
決め方
プロセス図の課題では、何かがどのように作られるか、あるいはある仕組みがどのように働くかが、1ステップずつ示されます。図には決まった順番があるので、レポートも最初の段階から最後の段階までその順番に沿って書きます。
段階の順番が崩れず、どのステップも抜けないように、決まった順番で進めましょう。
- グラフを読む. ステップの数を数え、矢印をたどって、過程がどこで始まりどこで終わるかを確認しましょう。
- 序論を書く. 課題文を言い換え、詳細は入れずに、何の過程かを書きましょう。
- グループに分ける. 過程の自然な区切りで段階をグループに分け、グループごとに本論の段落を1つ割り当てましょう。
- 全体の傾向を見つける. ステップがいくつあるか、そして最初から最後までの主な段階は何かを決めましょう。
- 概要と本論の段落を書く. まず過程の全体の流れをまとめ、それから順番にステップを説明しましょう。
- レポート全体の計画. 書いた各部分を通して読み、模範レポートと比べましょう。
プロセスのレポートは受け身で書きます。図に誰が作業をするかが書かれていることはまれなので、「is heated」「is mixed」「is stored」などの形を使い、「first」「after that」「finally」などの順序を表す語でステップをつなぎましょう。
読む
プロセス図は、矢印でつながった段階を示しています。ステップの数を数え、矢印をたどって、過程がどこで始まりどこで終わるかを確認しましょう。最後の矢印が最初の段階に戻っていれば、その過程はサイクルで、最終製品はありません。
序論
序論では、図が何を示しているかを述べます。課題文を書き写すのではなく自分の言葉で言い換え、何の過程かを書きましょう。これらの文には個々のステップを入れません。
グループ
タスク1のレポートでは、段階のグループごとに本論の段落が1つ必要です。ステップごとに段落を1つ書かないでください。場所、材料、目的が変わるところなど、過程の自然な区切りで分け、各グループが連続した段階のまとまりになるようにしましょう。ほとんどの過程は2つのグループに分かれます。短い過程なら1つ、長い過程なら3つになることもあります。
傾向
概要では、過程全体をひと目でわかるようにまとめます。ステップがいくつあるか、主な段階は何かです。過程がほかの何かと比べられることはまれなので、増加や減少を探すのではなく、過程の全体の流れを説明しましょう。
書く
概要を最初に書き、設備、時間、温度は入れずに全体的な内容にとどめます。そのあと、本論の各段落で、矢印が示す順番どおりにその段落のステップを説明します。「is heated」や「is poured」などの受け身の形を使い、「first」「next」「after that」「finally」などの順序を表す語でステップをつなぎましょう。
IELTSアカデミックライティングTask 1のプロセス図への取り組み方を学ぶには、7日間の無料体験にサインアップして、IELTSアカデミックライティングTask - プロセス図レッスンにアクセスしてください。
7日間無料体験地図
このタイプの質問では、1つ、2つ、または3つの地図が与えられます。
地図には町、都市、島、または他の地理的領域が示されている可能性があります。
地図は通常、一定期間にその地域で発生した変化を示しています。
変化は建設(例:観光のための地域開発)
または破壊(例:地震などの自然災害による地域への影響)に関連している可能性があります。
あなたの仕事は発生した変化の要約を書き、最も重要なポイントをカバーすることです。
The maps below show the centre of a small town called Islip as it is now, and plans for its development. Summarise the information by selecting and reporting the main features, and make comparisons where relevant.
- Write at least 150 words.
- You should spend around 20 minutes on this task.
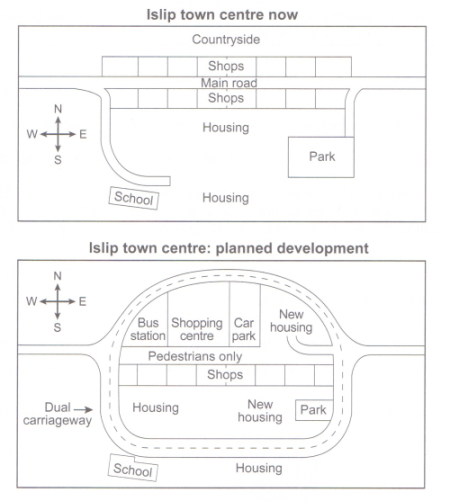
The diagrams illustrate some proposed changes to the central area of the town of Islip.
Overall, the principal change to the town will be the construction of a ring road around the centre. Various other developments with regard to shops and housing will accompany the building of this road.
As the first map reveals, lslip town center now is relatively small. There is a main road from the west to the east with shops on both sides. The northern area is rarely countryside, while the southern area is filled with houses with a school at the end of the fork road in the southwest corner and a park in the southeast area.
In the future, the main road is expected to reform into a dual carriageway as a round containing all the new buildings. The shops along the north side of the new pedestrian street will be demolished to make way for a bus station, shopping centre, car parks and new housing area. The shops along the south side of the street will remain, but it seems that the town's park will be reduced in size so that more new houses can be built within the ring road.
Map
Learn how to answer this question in a step-by-step interactive exercise
Map
IELTS アカデミックのタスク1の地図問題では、同じ場所を異なる時点で描いた図が2枚以上(たいていは2枚)示されます。その場所がどう変わったかを説明する150語以上のレポートを書きます。意見や理由は述べません。
課題を確認したら、「次へ」をクリックして進んでください。
設問を確認する
Write at least 150 words.
書き始める前に、まず地図を読み取りましょう。示されている場所、比較されている時点、そして地図が何枚あるかを確認します。次に、新しくできたもの、なくなったもの、今は別の用途に使われているものを探しましょう。
地図についての質問に答えてください。
グラフを読む
序論では、課題文を自分の言葉で言い換えます。地図が何を示しているか、どの期間を扱っているかを述べ、課題文をそのまま写さずに表現を変えましょう。細部、位置を表す表現、変化を表す動詞は後で使います。
課題文を言い換えた文を1〜2文書いてください。
序論を書く
課題の問い
The maps below show the centre of a small town called Islip as it is now, and plans for its development. Summarise the information by selecting and reporting the main features, and make comparisons where relevant.
Write at least 150 words.
タスク1のレポートには地図のグループごとに本論の段落が1つ必要です。たいていは、それぞれの地図が1つのグループになります。前の時点の地図を第1段落に、後の時点の地図を第2段落に書けば、時点がはっきり分かれます。まとめて説明したほうがよい2枚の地図は1つのグループにしてもかまいません。地図が3枚ある場合は、たいてい段落も3つになります。
特徴ごとに段落を作ったり、地図を半分に分けて段落を作ったりすると、時点どうしの比較が崩れてしまいます。
本論の段落がわかりやすくなるグループ分けを選んでください。
グループに分ける
本論の段落がわかりやすくなるグループ分けを選んでください。
- One group: now and planned development.
- Group 1: now. Group 2: planned development.
概要では、期間全体を通じた最も大きな変化を述べます。その場所が大きくなったのか小さくなったのか、どんな土地利用が現れ、どんな土地利用が消えたのかを考えましょう。個々の特徴や正確な位置は概要に入れません。
全体的な変化を表す答えを選んでください。
全体の傾向を見つける
次に、前のステップのメモを使って、自分の言葉で概要を書きましょう。1〜2文で十分です。その場所の全体的な発展を説明し、正確な位置、個々の特徴、変化の理由は書かないでください。
概要を1〜2文で書いてください。
概要を書く
本論の第1段落では、1つ目のグループの地図を詳しく説明します。すでに終わった状態には過去形を使い、「to the north of」「beside」「on the edge of」のような位置を表す表現を使って、読み手が各特徴の場所をつかめるようにしましょう。理由ではなく、特徴を説明します。
本論の第1段落を3〜4文で書いてください。
本論の段落1を書く
本論の第2段落では、2つ目のグループの地図と、前の地図からの変化を説明します。建てられたもの、取り除かれたもの、置き換えられたものには、「was built」「had been cleared」「has been converted」のような受動態を使いましょう。地図は誰がその作業をしたかを示していないからです。ここでも位置を表す表現で、それぞれの変化がどこで起きたかを示します。
本論の第2段落を3〜4文で書いてください。
本論の段落2を書く
これで各セクションが1つのレポートになりました。序論、概要、そして地図のグループごとの本論の段落です。順番に読み、概要が全体像を述べ、本論の段落が細部を伝えているか確認しましょう。
レポートの構成を読み、模範レポートと比べてください。
レポート全体の計画
決め方
地図の課題では、同じ場所の異なる時期の図面が2枚以上示されます。すべてのラベルを説明する必要はありません。時期と時期の間で、その場所がどう変わったかを報告します。
細部より先に全体像を述べるレポートになるように、決まった順番で進めましょう。
- グラフを読む. 計画を立てる前に、場所、時期、各地図の主な特徴を確認しましょう。
- グループに分ける. 情報を地図のグループに分け、グループごとに本論の段落を1つ書きます。ふつうは前の時期の地図を先に、あとの時期の地図をそのあとにします。
- 全体の傾向を見つける. 拡大、縮小、土地の新しい使い方など、期間全体でいちばん大きな変化を決めましょう。
- レポートを段階的に書く. 序論、概要の順に書き、それからグループごとに本論の段落を1つずつ書きましょう。
- レポート全体の計画. 各部分を通して読み、模範レポートと比べましょう。
地図のレポートを支えるのは、位置を表す表現と受け身の形です。「to the north of」や「beside the river」などのフレーズで各特徴の位置を示し、「was built」や「had been removed」などの形で、誰がしたかを言わずに変化を報告します。
読む
計画を立てる前に、地図が何を示しているかを確認しましょう。場所、時期、各地図の主な特徴です。それから、何が新しくできたか、何がなくなったか、何が別の用途に使われるようになったかを探しましょう。この読み取りの段階を踏むことで、1枚の地図だけを説明してしまうのを防げます。
グループ
IELTS タスク1のレポートでは、地図のグループごとに本論の段落が1つ必要です。ふつうは地図1枚が1つのグループで、前の時期の地図を先に、あとの時期の地図をそのあとに書きます。いっしょに説明したほうがよい2枚の地図は1つのグループにしてもかまいません。地図が3枚なら、たいてい段落も3つです。分け方は書く前に決めましょう。それによってレポート全体の順番が決まるからです。
概要
概要では、細かい点ではなく、期間全体でいちばん大きな変化を述べます。その場所が大きくなったのか小さくなったのか、どんな種類の土地利用が現れたり消えたりしたのかを考えましょう。個々の特徴や正確な位置は、本論の段落で書きます。
書く
レポートは短い段階に分けて組み立てます。序論で課題文を言い換え、概要で主な変化を述べ、本論の段落でグループを1つずつ説明します。すでに終わった状態には過去の形を、変化には「was built」や「had been cleared」などの受け身の形を使い、各特徴の位置は位置を表す表現で示しましょう。
IELTSアカデミックライティングTask 1の地図への取り組み方を学ぶには、7日間の無料体験にサインアップして、IELTSアカデミックライティングTask - 地図レッスンにアクセスしてください。
7日間無料体験混合データ
このタイプの課題では、2セットのデータが与えられます。
データは異なるタイプのものになります。例えば、1つのセットは時間の経過に伴う変化で、2つ目のセットは静的なものである可能性があります。
あるいは、1つのデータセットがパーセンテージを示し、2つ目のセットが数値を示している可能性もあります。
また、イラスト(例:図や地図)とデータセット(例:棒グラフ、折れ線グラフ、円グラフ、表)が与えられる場合もあります。
あなたの仕事は両方のデータセットを要約することです。
The pie graph depicts the main reasons for the productivity loss of agricultural land worldwide. The table shows how these causes influenced three world regions during the 2000s.
Summarise the information by selecting and reporting the main features, and make comparisons where relevant.
Causes of Land Degradation by Region (%) | ||||
Region: | Deforestation | Over-cultivation | Over-grazing | Total land degraded |
North America | 0.3 | 3.4 | 1.7 | 5.4 |
Asia | 9.8 | 7.8 | 5.7 | 23.3 |
Australia & Oceania | 1.6 | 0.3 | 11 | 12.9 |
- Write at least 150 words.
- You should spend around 20 minutes on this task.
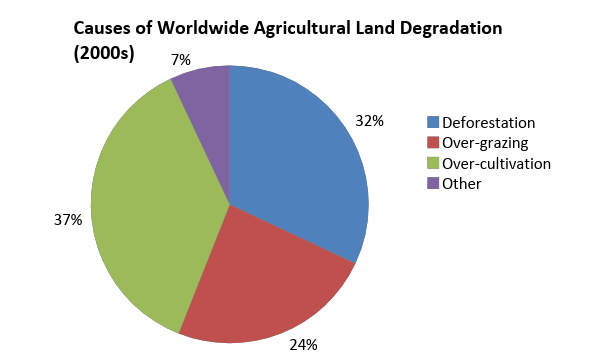
The pie chart shows the four main causes of farmland degradation in the world today, while the table presents the amount of land surface area affected by each one in three separate global regions during the 2000s.
Overall, Asia suffered more from the deterioration of farmland than other regions owing to deforestation and over-cultivation which were also the primary reasons for agricultural land loss worldwide.
Globally, 69% of degraded land is attributed to excessive cultivation and tree clearance, constituting 37% and 32% respectively. A further quarter of global land loss is due to over cultivation of crops. Other causes made up only 7% collectively.
In the 2000s, these causes affected regions of our planet differently. Asia was the worst affected where the top two causes of global land loss, deforestation and over-cultivation, resulted in 9.8% and 7.8% of degraded land there. The impact on Australia and Oceania was less severe though over-grazing was the predominant cause of land deterioration at eleven percent. The least affected of all was North America where only 5.4% of land was diminished, principally because of over-cultivation at 3.4%.
Mixed Charts
Learn how to answer this question in a step-by-step interactive exercise
Mixed Charts
IELTS アカデミックのタスク1の複合グラフ問題では、1つのテーマについて種類の異なる図表が2つ以上示されます。主な特徴を報告し、図表どうしを結びつける150語以上のレポートを書きます。意見や理由は述べません。
課題を確認したら、「次へ」をクリックして進んでください。
設問を確認する
Summarise the information by selecting and reporting the main features, and make comparisons where relevant.
Write at least 150 words.
書き始める前に、まず図表を読み取りましょう。それぞれの図表が何を示しているかを確認し、構成を考える前にすべての軸ラベルと単位を読みます。種類の異なる図表は別々のものを測っていることが多いので、同じ集団や同じ期間など、共通している点をメモしておきましょう。
図表についての質問に答えてください。
グラフを読む
序論では、課題文を自分の言葉で言い換えます。各図表が何を示し、どの集団と期間を扱っているかをはっきりさせ、課題文をそのまま写さずに表現を変えましょう。数値や図表どうしのつながりは後で書きます。
課題文を言い換えた文を1〜2文書いてください。
序論を書く
課題の問い
The pie graph depicts the main reasons for the productivity loss of agricultural land worldwide. The table shows how these causes influenced three world regions during the 2000s.
Summarise the information by selecting and reporting the main features, and make comparisons where relevant.
Write at least 150 words.
タスク1のレポートには図表のグループごとに本論の段落が1つ必要です。複合グラフでは、グループは1〜3つになります。同じ種類や同じテーマの図表はまとめましょう。2つの異なる指標が混ざった段落は読みにくいからです。同じものを示す2つの円グラフは1つの段落にまとめ、別の指標を示す折れ線グラフには独自の段落を立てます。
図表ごとに段落を作ると、まとめるべきものが分かれてしまうことがあります。すべての図表を1つの段落にまとめると、指標が混ざってしまいます。年や最高値・最低値で分けると、課題が求めている比較が崩れてしまいます。
各段落に明確な指標が1つずつ入るグループ分けを選んでください。
グループに分ける
各段落に明確な指標が1つずつ入るグループ分けを選んでください。
- Group 1: the pie chart. Group 2: the table.
- One group: the pie chart and the table.
概要では、すべての図表を通じた最も大きなパターンを述べます。概要は細部より先に書きます。各図表の主な動きを見つけ、ある図表が別の図表を裏付けているか、説明しているかを判断しましょう。正確な数値は概要に入れません。
主なパターンを表す答えを選んでください。
全体の傾向を見つける
次に、前のステップのメモを使って、自分の言葉で概要を書きましょう。1〜2文で十分です。主なパターンと図表どうしのつながりを述べ、正確な数値やパターンの理由は書かないでください。
概要を1〜2文で書いてください。
概要を書く
本論の第1段落では、1つ目のグループを詳しく説明します。最高点、最低点、最もはっきりした変化など、重要な比較を報告し、それぞれをいくつかの選んだ数値で裏付けましょう。すべての数値を並べたり、ここで他のグループを説明したりしないでください。
本論の第1段落を3〜4文で書いてください。
本論の段落1を書く
本論の第2段落では、2つ目のグループを説明し、1つ目と結びつけます。項目を一つずつ順に取り上げるのではなく、関連する比較をまとめ、つなぎの表現を使って図表どうしが一致している点を示しましょう。理由ではなく、データが示していることを報告します。
本論の第2段落を3〜4文で書いてください。
本論の段落2を書く
これで各セクションが1つのレポートになりました。序論、概要、そして図表のグループごとの本論の段落です。順番に読み、概要が全体像を述べ、本論の段落が細部を伝えているか確認しましょう。
レポートの構成を読み、模範レポートと比べてください。
レポート全体の計画
決め方
複合グラフの課題では、1つのテーマについて種類の違う図が2つ以上示されます。図ごとに別々のレポートを書くのではありません。それぞれの主な特徴を報告し、データがつながっているところでは図どうしを関連づけます。
細部より先に全体像を述べるレポートになるように、決まった順番で進めましょう。
- グラフを読む. 計画を立てる前に、各図が何を示しているかを確認し、すべての軸、ラベル、単位を読みましょう。
- グループに分ける. 図を1〜3つのグループに分け、グループごとに本論の段落を1つ書きます。ふつうは、1つのグループに1種類のグラフか1つのテーマを入れます。
- 全体の傾向を見つける. すべての図を通していちばん大きなパターンを決め、図どうしのつながりがあれば書き留めましょう。
- レポートを段階的に書く. 序論、概要の順に書き、それからグループごとに本論の段落を1つずつ書きましょう。
- レポート全体の計画. 各部分を通して読み、模範レポートと比べましょう。
すべての数値を並べるのではなく、重要な比較をまとめましょう。図を見ればわかることを繰り返すだけの長い数値の列挙より、パターンを裏付けるために選んだいくつかの数値のほうが高く評価されます。
読む
種類の違う図は違うものを測っているので、まず1つずつ読みましょう。タイトル、軸のラベル、単位、期間を確認し、同じ人々のグループや同じ期間など、図どうしに共通するものを書き留めます。円グラフの時間の割合と折れ線グラフの合計は、同じ尺度ではありません。
グループ
IELTS タスク1のレポートでは、図のグループごとに本論の段落が1つ必要なので、図を1つ、2つ、または3つのグループに分けなければなりません。同じ種類や同じテーマの図は同じグループにし、違うものを測っている図には段落を1つ割り当てましょう。分け方は書く前に決めましょう。それによってレポート全体の順番が決まるからです。
概要
概要では、すべての図を通していちばん大きなパターンを1〜2文で述べます。各図の主な動きを見つけ、ある図がもう一方の図を裏付けているか、説明しているかを判断しましょう。正確な数値や個々のカテゴリーは、本論の段落で書きます。
書く
レポートは短い段階に分けて組み立てます。序論で課題文を言い換え、概要で主なパターンを述べ、本論の段落でグループを1つずつ説明します。本論の段落では、関連する比較をまとめ、すべての数値を並べるのではなく、選んだいくつかの数値でそれぞれを裏付けましょう。
IELTSアカデミックライティングTask 1の混合データへの取り組み方を学ぶには、7日間の無料体験にサインアップして、IELTSアカデミックライティングTask - 混合データレッスンにアクセスしてください。
7日間無料体験IELTSアカデミックライティングTask 1の語彙
この課題で高得点を取るためには、円/棒/折れ線/混合グラフで与えられたデータを提示するために適切な単語やフレーズの使い方を学ぶ必要があります。 7日間の無料体験にサインアップして、以下のレッスンを完了することをお勧めします。
- IELTSアカデミックライティングTask 1レッスン - 数字について書く方法
- IELTSアカデミックライティングTask 1レッスン - パーセンテージについて書く方法
- IELTSアカデミックライティングTask 1レッスン - データの変化について書く方法
IELTSライティングTask 1サンプル
このセクションでは、IELTSアカデミックライティングTask 1のIELTSライティングサンプルのリストを提示します。
IELTSジェネラルライティングTask 1
IELTSジェネラルトレーニングライティングTask 1では、ある状況が提示され、少なくとも150語のインフォーマル、セミフォーマル、フォーマルな手紙の形で個人的な回答を書く必要があります。書くよう求められる状況は、以下のような一般的で日常的なものです。
- 大学の寮の管理者に宿泊施設の問題について書く、
- 新しい雇用主に時間管理の問題について書く、
- 地元の新聞に地元の空港を開発する計画について書く、
- 不動産会社に家の暖房システムの問題を解決するために書く。
状況に関しては、回答に含める必要のある3つの箇条書きの形で情報が与えられます。情報を要求または提供したり、状況を説明したりするよう求められる場合があります。これを行うには、以下のいくつかを行う必要がある場合があります。
- 一般的な事実情報を求めたり提供したりする、
- 必要、欲求、好み、嫌悪を表現する、
- 意見や苦情を表現する、
- 要求や提案/推奨を行う。
IELTSジェネラルライティングのスタイル
使用するライティングスタイルは、誰に書くよう求められているか(つまり読者)とその人をどれだけよく知っていることになっているかによって異なります。読者にふさわしく、ライティングの目的を達成するのに役立つスタイルで書く必要があります。例えば、友人に書く(インフォーマル)、またはマネージャーに書く(セミフォーマルまたはフォーマル)などです。手紙の冒頭に住所を含める必要はありません。
IELTSジェネラルライティングTask 1で減点を避ける方法
前述のとおり、この課題に20分以上時間をかけず、少なくとも150語を書くようにしてください。そうしないと減点されます。150語以上書くことに対して減点はされませんが、Task 1の回答が長くなると、ライティングバンドスコアに2倍寄与するTask 2に費やす時間が少なくなる可能性があることを覚えておいてください。
また、回答が話題から外れていたり、完全につながったテキストとして書かれていない場合(例:回答のどの部分でも箇条書きを使用したり、メモ形式など)、無関係性に対して減点されることも覚えておいてください。盗作(つまり別のソースからコピーすること)に対しては厳しく減点されます。
Last weekend, your cousin celebrated her 50th birthday, but you couldn't attend and you forgot to cancel.
Write a letter to your cousin. In your letter:
- Apologize for missing the birthday celebration
- Explain why you missed it and why you hadn't let her know
- Describe how you will make it up to her
You do NOT need to write any addresses.
Begin your letter as follows:
Dear ___,
- Write at least 150 words.
- You should spend around 20 minutes on this task.
Dear Marnie,
Happy belated birthday! I hope you're doing well and that you had a great 50th birthday party.
I'm so sorry that I wasn't at your party to celebrate with you. It's been such a long time since we've been able to catch up and see each other.
To be completely honest, I've been swamped with work lately, and I was asked to go on a last-minute business trip a few days before your birthday. I was so busy that I had completely forgotten about your party, and it didn't occur to me to call you and cancel.
My busy schedule is absolutely not an excuse for missing your 50th birthday, though, and I would love to make it up to you. I've reserved a table for two next Friday night at the new sushi restaurant in town. Can I please treat you to a luxurious birthday dinner?
I hope we can celebrate together next Friday!
Speak to you soon,
Jessica
Total Word Count: 162 words

Task Achievement — Letter
Learn how to answer this question in a step-by-step interactive exercise
Task Achievement — Letter
IELTS ジェネラル・トレーニングのタスク1では、ある状況に対応する手紙を書きます。課題の達成度は、課題文の箇条書きの項目をすべて扱っているかどうかで決まります。よく書けた手紙でも、1つでも抜けていれば減点されます。
状況、箇条書きの項目、そして課題に書き出しの一文があればそれも読みましょう。
課題を確認したら、「次へ」をクリックして進んでください。
設問を確認する
Write a letter to your cousin. In your letter:
- Apologize for missing the birthday celebration
- Explain why you missed it and why you hadn't let her know
- Describe how you will make it up to her
Write at least 150 words. You do NOT need to write any addresses.
Begin your letter as follows:
Dear ___,
書く前に、3つの質問に答えて手紙の構成を考えましょう。誰に宛てて書くのか、なぜ書くのか、手紙に何を入れなければならないのか。
読み手によって言葉づかいの丁寧さが決まり、目的によって書き出しが決まり、箇条書きの項目によって内容が決まります。答えはすべて課題文の中にあります。
構成を考えるための各質問を、その答えとなる課題文の部分と組み合わせてください。
課題を理解する
構成を考えるための各質問を、その答えとなる課題文の部分と組み合わせてください。
書き出しのあいさつと結びのあいさつは、手紙がどのくらい改まったものかを読み手に伝えます。そのため、宛てる相手に合っている必要があります。知らない人や上司への手紙はフォーマルに、友人への手紙はインフォーマルに書きます。
手紙の最初と最後は同じ丁寧さにそろえましょう。フォーマルなあいさつで始めてくだけた結びで終えると、読み手が戸惑います。
読み手に合った書き出しと結びのあいさつを選んでください。
あいさつと結びの言葉を選ぶ
Confirm the greeting
- Dear ___,
- Dear Sir or Madam,
- Dear Ms. Smith,
- Hey you,
Choose a closing
- Speak to you soon,
- Lots of love,
- Best wishes,
- Yours faithfully,
- Yours sincerely,
1つ目の箇条書きの項目には、独立した段落を1つ割り当てましょう。課題の達成度は、各項目にただ触れているかではなく、扱われ、十分に展開されているかどうかで評価されます。
文の書き出しの表現が用意されています。続きは自分の言葉で書き、書き出しのあいさつと同じトーンを保ちましょう。
1つ目の箇条書きの項目を扱う段落を書いてください。
箇条書きの項目1を書く
Apologise for missing the birthday celebration
2つ目の箇条書きの項目にも独立した段落が必要です。半分しか答えていない項目も減点されるので、1つ目と同じくらいの長さと詳しさで書きましょう。
書き出しの表現を使って始め、この状況で読み手が実際に必要とする詳細を加えましょう。
2つ目の箇条書きの項目を扱う段落を書いてください。
箇条書きの項目2を書く
Explain why you missed it and did not let her know
3つ目の箇条書きの項目で手紙の本文を締めくくります。3つすべてを完全な文で扱えば、課題は完了です。
最後までトーンをそろえ、この段落が箇条書きの項目で実際に求められていることに答えているか確認しましょう。
3つ目の箇条書きの項目を扱う段落を書いてください。
箇条書きの項目3を書く
Describe how you will make it up to her
書き出しと結びのあいさつも入り、段落が1通の手紙としてまとまりました。1つの文章として読み、箇条書きの項目がすべて扱われているか確認しましょう。
自分の表現を手紙の解答例と比べ、書き出しのあいさつから結びのあいさつまで、トーンがどのように一貫しているかに注目しましょう。
手紙を見直してから、「次へ」をクリックして進んでください。
完成した手紙を見直す
決め方
タスク1の手紙では、ある状況に対応し、いくつかの箇条書きの項目をカバーします。課題の達成度は、すべての箇条書きの項目をカバーし、相手に合ったトーンで書いているかで決まります。
箇条書きの項目を1つも落とさず、丁寧さのレベルが最後まで変わらないように、決まった順番で進めましょう。
- 課題を理解する. 誰に宛てて書くのか、なぜ書くのか、手紙に何を入れなければならないのかを確認しましょう。
- あいさつと結びの言葉を選ぶ. 書き出しと結びを相手に合わせ、どちらも同じ丁寧さのレベルにそろえましょう。
- 箇条書きの項目を書く. 箇条書きの項目ごとに段落を1つ割り当て、具体的な詳細を使って展開しましょう。
- 完成した手紙を見直す. 段落を通して読み、すべての箇条書きの項目をカバーしているかを確認しましょう。
箇条書きの項目ごとに段落を1つ書きましょう。このシンプルな計画なら、箇条書きの項目を書き落とすことはほぼなくなります。項目を書き落とすことは、課題の達成度で得点を失ういちばんの近道です。
計画
3つの問いで手紙全体の計画が立ちます。誰に宛てて書くのか、なぜ書くのか、手紙に何を入れなければならないのか。どの答えも、課題文のどこかにすでに書かれています。
トーン
書き出しのあいさつと結びの言葉で、手紙がどのくらいフォーマルかが相手に伝わります。知らない人や上司への手紙はフォーマル、友人への手紙はインフォーマルです。手紙の最初と最後は、同じ丁寧さのレベルにそろえなければなりません。
箇条書きの項目
箇条書きの項目ごとに段落を1つ割り当てます。相手が本当に必要とする詳細を入れて完全な文で書き、どのポイントも急いで書いたように見えないよう、段落の長さをそろえましょう。
IELTSジェネラルライティングTask 1の詳細については、IELTSジェネラルライティングTask 1の究極のガイドをご覧ください。
IELTSライティングTask 2
IELTSライティングTask 2では、質問に答える形で従来型のスタイルのエッセイを書く必要があります。 少なくとも250語を書く必要があります。十分な単語数を書かないと減点されます。 Task 2には6種類の質問タイプがあります。各エッセイタイプのサンプル問題とモデルエッセイを見てみましょう。
原因と結果
このタイプの質問では、問題または状況が与えられます。あなたの仕事は、その状況の原因と その状況のいくつかの影響を説明することです。
It is observed that in many countries not enough students are choosing to study science at university. What are the causes? And what will be the effects on society?
- Write at least 250 words.
- You should spend around 40 minutes on this task.
It is a fact that many students globally are avoiding science in favor of other subjects at university. Such a trend is largely due to how science is perceived, which may be having a detrimental effect on a nation’s development.
The primary reason for the drop in enrollment in science-based courses is that many undergraduates are put off by their difficulty. While many high school students enjoy science, they soon find themselves facing a lot of theory and research based courses once in college. For example according to a recent poll of UK universities, many students stated that while science was interesting in high school, there was too much theory learnt in classes, and not enough application in the lab to make it interesting. Furthermore, there are plenty of easier alternatives such as humanities for students to choose from these days. As a result, most choose a more appealing humanities degree over a science one.
Countries with the lowest science enrollment rates are affected the most competitively and economically. Fewer science graduates mean a shortage of skilled researchers in science-related fields like bio-engineering which reduces a countries competitiveness in attracting foreign investment. In other words foreign companies are usually unwilling to invest in nations with a low pool of skilled workers. In addition, a low number of skilled workers mean fewer technological developments for such countries, which may cause their economies to suffer from lost business in being the first to market with new products. For example, evidence shows that the number of patents filed by Chinese corporations is beginning to threaten the number credited to American ones.
In conclusion, there is a direct correlation between the perceived difficulty of science degrees and limited economic growth. Only by changing this attitude will countries reverse this trend.
Task Achievement — Task 2
Learn how to answer this question in a step-by-step interactive exercise
Task Achievement — Task 2
IELTS ライティングのタスク2では、設問のすべての要素に答えるエッセイを書きます。主張文と指示文を注意深く読み、設問が何について論じるよう求めているかに注目しましょう。
テーマからは外れていなくても、実際に問われたことに答えていないエッセイは、高いバンドスコアには届きません。
問題を確認したら、「次へ」をクリックして進んでください。
設問を確認する
序論を2文、合計25〜35語程度で書きましょう。まず、設問を自分の言葉で書き直します。自分の言葉や同義語を使って設問を言い換えましょう。そうすることでエッセイがテーマから外れず、幅広い語彙力も示せます。2文目では、本論の段落で論じる具体的なトピックを紹介します。
序論を書いてください。
序論を書く
本論の各段落には、その要点を示すトピックセンテンスが必要です。この長さのエッセイなら、本論の段落は2つで十分です。
各段落について、はっきりした文を1つずつ書きましょう。各文は12〜20語に収め、説明や例は次のステップに残しておきます。
本論の各段落のトピックセンテンスを1つずつ書いてください。
トピックセンテンスを2つ書く
science courses are seen as too hard
fewer scientists hurt the economy
トピックセンテンスは、裏付けがあって初めて得点になります。本論の第1段落を2つのポイントで展開しましょう。それぞれのポイントについて、説明と具体的な例を書きます。
本論の各段落は4–5文、つまり60〜80語程度にします。一般的な記述よりも、具体的な状況を挙げたほうが説得力があります。
本論の第1段落の残りを書いてください。
本論の段落1を展開する
60
本論の第2段落も、第1段落と同じくらい掘り下げて書きましょう。2つのポイントを挙げ、それぞれを説明と例で裏付けます。
本論の各段落は4–5文、つまり60〜80語程度にします。第1段落の内容を言葉を変えて繰り返さないでください。
本論の第2段落の残りを書いてください。
本論の段落2を展開する
60
結論でエッセイを締めくくります。要点を2文でまとめ、その後に、このテーマがなぜ重要かについて1〜2文を加えましょう。
序論をそのまま写したり、新しい論点を加えたりしないでください。結論全体は35〜50語に収めます。
結論を3–4文で書いてください。
結論を書く
35
序論、トピックセンテンス、本論の段落、結論が、1つのエッセイとしてまとまりました。1つの文章として読み、設問のすべての要素に答えているか確認しましょう。
自分の表現をエッセイの解答例と比べ、各段落がそれぞれ別の役割を果たしていることに注目しましょう。
エッセイを見直してから、「次へ」をクリックして進んでください。
完成したエッセイを見直す
決め方
タスク2のエッセイでは、設問のすべての部分に答えます。課題の達成度は、設問が求めていることをカバーし、主なポイントをそれぞれ説明と例で裏付けているかで決まります。
決まった順番で進めましょう。序論、2つのトピックセンテンス、展開した2つの本論の段落、そして結論です。
- 序論を書く.
ふつう、この段落には2つの文が必要です。自分の言葉と同義語を使って設問を言い換えましょう。こうすることでエッセイがテーマから外れず、幅広い語彙を示すこともできます。2文目では、本論の段落で論じる具体的なトピックを紹介します。したがって、序論には次の内容を入れましょう:
- 言い換えた設問
- 具体的なトピックの紹介
- トピックセンテンスを2つ書く. 本論の各段落に、トピックセンテンスを1つずつ書きましょう。
- 本論の段落を展開する. 本論の各段落を2つのポイントで裏付け、それぞれのポイントに説明と例を加えましょう。本論の各段落は4〜5文程度にします。
- 結論を書く. 主なポイントをまとめ、そのテーマがなぜ重要かを述べましょう。
- 完成したエッセイを見直す. 各部分を通して読み、設問のすべての部分に答えているかを確認しましょう。
展開した2つの段落は、展開していない4つのポイントより高く評価されます。試験官は裏付けを評価するので、ポイントを増やすのではなく、すでにあるポイントに説明と例を加えましょう。
序論
ふつう、この段落には2つの文が必要です。自分の言葉と同義語を使って設問を言い換えましょう。こうすることでエッセイがテーマから外れず、幅広い語彙を示すこともできます。2文目では、本論の段落で論じる具体的なトピックを紹介します。したがって、序論には次の内容を入れましょう:
- 言い換えた設問
- 具体的なトピックの紹介
トピックセンテンス
本論の各段落に、トピックセンテンスを1つずつ書きましょう。それぞれの文で、その段落の要点を12〜20語で導入し、例は次の段階にとっておきます。
裏付け
トピックセンテンスは、裏付けがあって初めて得点になります。そのポイントがなぜ正しいのかを説明し、具体的な例を挙げ、2つの本論の段落に同じくらいの裏付けを入れましょう。本論の各段落は4〜5文程度にします。
結論
結論では、主なポイントを2文でまとめ、そのテーマがなぜ重要かを1〜2文で加えます。序論を書き写したり、新しい論点を加えたりしないでください。
両方の見解を議論し、自分の意見を述べる
このタイプの質問では、問題に関連する2つの対立する見解が与えられます。通常、2つの見解は別々の文にあり、 "however"などの転換語で接続されて、2つの見解が対照的であることを示します。あなたの仕事は、論述エッセイを書くことであり、 問題の両側を対比させ、自分の見解を提示することです。
Some people argue that the public should be allowed to have guns. Others do not agree. Discuss both points of view and give your opinion.
- Write at least 250 words.
- You should spend around 40 minutes on this task.
Gun ownership is a controversial topic with some people arguing that the public should have the choice to own them, while others disagree wholeheartedly with the idea. In my opinion, I believe that the public should only be entitled to own guns after having proper training.
The benefits of gun ownership are touted in some countries more than others. In countries where owning one is a civic right, like the United States, it is legal to use one in self-defense is legal. With muggings, murder and burglary rising in many countries, there may be some truth to the claim that owing a gun gives the owner increased security. Furthermore, in remote or dangerous areas, guns may be a necessity rather than an option. Without police nearby, properly stored, guns may be a great asset in deterring criminals from breaking and entering a remote property.
However, rather than deter violence, guns tend to escalate it in areas where they are widely available. Research shows that violent crime increases dramatically when guns are prevalent in society. When the public is armed, criminals and the police become so too, creating a situation in which guns beget more guns and eventually death. Additionally, greater ease of access is dangerous for children. Having a gun easily accessible may tempt children to abuse them as evidenced by the almost weekly school shootings in the US. There is further a proven link between increased suicide rates when guns are present.
It is my belief that the general public should be barred from owning guns of any kind. Also, guns should be restricted to specialists with a proven need for a firearm such as soldiers or hunters. While there are certain circumstances where owning a gun is an advantage, in the vast majority of situations there is no place for a gun in modern society.
Task Achievement — Task 2
Learn how to answer this question in a step-by-step interactive exercise
Task Achievement — Task 2
IELTS ライティングのタスク2では、設問のすべての要素に答えるエッセイを書きます。主張文と指示文を注意深く読み、設問が何について論じるよう求めているかに注目しましょう。
テーマからは外れていなくても、実際に問われたことに答えていないエッセイは、高いバンドスコアには届きません。
問題を確認したら、「次へ」をクリックして進んでください。
設問を確認する
序論を2文、合計25〜35語程度で書きましょう。まず、設問を自分の言葉で書き直します。自分の言葉や同義語を使って設問を言い換えましょう。そうすることでエッセイがテーマから外れず、幅広い語彙力も示せます。2文目では、本論の段落で論じる具体的なトピックを紹介します。
序論を書いてください。
序論を書く
本論の各段落には、その要点を示すトピックセンテンスが必要です。この長さのエッセイなら、本論の段落は2つで十分です。
各段落について、はっきりした文を1つずつ書きましょう。各文は12〜20語に収め、説明や例は次のステップに残しておきます。
本論の各段落のトピックセンテンスを1つずつ書いてください。
トピックセンテンスを2つ書く
guns help people defend themselves
more guns lead to more violence
トピックセンテンスは、裏付けがあって初めて得点になります。本論の第1段落を2つのポイントで展開しましょう。それぞれのポイントについて、説明と具体的な例を書きます。
本論の各段落は4–5文、つまり60〜80語程度にします。一般的な記述よりも、具体的な状況を挙げたほうが説得力があります。
本論の第1段落の残りを書いてください。
本論の段落1を展開する
60
本論の第2段落も、第1段落と同じくらい掘り下げて書きましょう。2つのポイントを挙げ、それぞれを説明と例で裏付けます。
本論の各段落は4–5文、つまり60〜80語程度にします。第1段落の内容を言葉を変えて繰り返さないでください。
本論の第2段落の残りを書いてください。
本論の段落2を展開する
60
結論でエッセイを締めくくります。要点を2文でまとめ、その後に、このテーマがなぜ重要かについて1〜2文を加えましょう。
序論をそのまま写したり、新しい論点を加えたりしないでください。結論全体は35〜50語に収めます。
結論を3–4文で書いてください。
結論を書く
35
序論、トピックセンテンス、本論の段落、結論が、1つのエッセイとしてまとまりました。1つの文章として読み、設問のすべての要素に答えているか確認しましょう。
自分の表現をエッセイの解答例と比べ、各段落がそれぞれ別の役割を果たしていることに注目しましょう。
エッセイを見直してから、「次へ」をクリックして進んでください。
完成したエッセイを見直す
決め方
タスク2のエッセイでは、設問のすべての部分に答えます。課題の達成度は、設問が求めていることをカバーし、主なポイントをそれぞれ説明と例で裏付けているかで決まります。
決まった順番で進めましょう。序論、2つのトピックセンテンス、展開した2つの本論の段落、そして結論です。
- 序論を書く.
ふつう、この段落には2つの文が必要です。自分の言葉と同義語を使って設問を言い換えましょう。こうすることでエッセイがテーマから外れず、幅広い語彙を示すこともできます。2文目では、本論の段落で論じる具体的なトピックを紹介します。したがって、序論には次の内容を入れましょう:
- 言い換えた設問
- 具体的なトピックの紹介
- トピックセンテンスを2つ書く. 本論の各段落に、トピックセンテンスを1つずつ書きましょう。
- 本論の段落を展開する. 本論の各段落を2つのポイントで裏付け、それぞれのポイントに説明と例を加えましょう。本論の各段落は4〜5文程度にします。
- 結論を書く. 主なポイントをまとめ、そのテーマがなぜ重要かを述べましょう。
- 完成したエッセイを見直す. 各部分を通して読み、設問のすべての部分に答えているかを確認しましょう。
展開した2つの段落は、展開していない4つのポイントより高く評価されます。試験官は裏付けを評価するので、ポイントを増やすのではなく、すでにあるポイントに説明と例を加えましょう。
序論
ふつう、この段落には2つの文が必要です。自分の言葉と同義語を使って設問を言い換えましょう。こうすることでエッセイがテーマから外れず、幅広い語彙を示すこともできます。2文目では、本論の段落で論じる具体的なトピックを紹介します。したがって、序論には次の内容を入れましょう:
- 言い換えた設問
- 具体的なトピックの紹介
トピックセンテンス
本論の各段落に、トピックセンテンスを1つずつ書きましょう。それぞれの文で、その段落の要点を12〜20語で導入し、例は次の段階にとっておきます。
裏付け
トピックセンテンスは、裏付けがあって初めて得点になります。そのポイントがなぜ正しいのかを説明し、具体的な例を挙げ、2つの本論の段落に同じくらいの裏付けを入れましょう。本論の各段落は4〜5文程度にします。
結論
結論では、主なポイントを2文でまとめ、そのテーマがなぜ重要かを1〜2文で加えます。序論を書き写したり、新しい論点を加えたりしないでください。
長所と短所
このタイプの質問では、状況、解決策、または傾向の肯定的および否定的な側面を議論するよう求められます。 また、どちらの側がより重要と思うかについて意見を述べるよう求められる場合もあります。
In some countries, governments are encouraging industries and businesses to move to regional areas outside the big cities. Do the advantages of this trend outweigh the disadvantages?
- Write at least 250 words.
- You should spend around 40 minutes on this task.
There is a movement among some countries to promote regional areas away from cities as attractive to business and industry. In my opinion, I consider relocation of business to bring about more drawbacks than benefits over the long term.
There are several attractive benefits to businesses moving to regional areas. For businesses rural locations mean lower land prices. Cheaper land allows large or small business equal prospects to become established cheaply with additional room to expand. As an example, the average size of a business in UK cities is currently 25 square meters while those in the rural locales average around 50m2. Additionally, countries benefits principally from the direct investment in underperforming parts of the country. Having companies operating in less urbanized areas, creates jobs, attracts talent and increases immigration which brings greater wealth.
On the other hand, relocation is not without its drawbacks. For one thing, locations away from population centers may mean a greater distance to market for goods. As a result, cost savings from cheaper land may be mitigated by the increased transportation costs of shipping products to customers. For another thing, there are often fewer skilled workers in regional areas. It may not be easy to attract employees to work in out-of-the-way places, which would mean longer commutes for staff from nearby cities at the expense of the company coffers. Lastly, increased business in country areas, disturbs the life of local residents. Country roads are not built for heavy trucks or traffic which may cause increased noise, congestions and inconvenience to those living nearby.
To sum up, while regional settings may be well suited to certain internet-based businesses, for more traditional companies, the distance from the city presents many challenges to overcome.
Task Achievement — Task 2
Learn how to answer this question in a step-by-step interactive exercise
Task Achievement — Task 2
IELTS ライティングのタスク2では、設問のすべての要素に答えるエッセイを書きます。主張文と指示文を注意深く読み、設問が何について論じるよう求めているかに注目しましょう。
テーマからは外れていなくても、実際に問われたことに答えていないエッセイは、高いバンドスコアには届きません。
問題を確認したら、「次へ」をクリックして進んでください。
設問を確認する
序論を2文、合計25〜35語程度で書きましょう。まず、設問を自分の言葉で書き直します。自分の言葉や同義語を使って設問を言い換えましょう。そうすることでエッセイがテーマから外れず、幅広い語彙力も示せます。2文目では、本論の段落で論じる具体的なトピックを紹介します。
序論を書いてください。
序論を書く
本論の各段落には、その要点を示すトピックセンテンスが必要です。この長さのエッセイなら、本論の段落は2つで十分です。
各段落について、はっきりした文を1つずつ書きましょう。各文は12〜20語に収め、説明や例は次のステップに残しておきます。
本論の各段落のトピックセンテンスを1つずつ書いてください。
トピックセンテンスを2つ書く
cheaper land and new jobs in the regions
higher transport costs and fewer skilled workers
トピックセンテンスは、裏付けがあって初めて得点になります。本論の第1段落を2つのポイントで展開しましょう。それぞれのポイントについて、説明と具体的な例を書きます。
本論の各段落は4–5文、つまり60〜80語程度にします。一般的な記述よりも、具体的な状況を挙げたほうが説得力があります。
本論の第1段落の残りを書いてください。
本論の段落1を展開する
60
本論の第2段落も、第1段落と同じくらい掘り下げて書きましょう。2つのポイントを挙げ、それぞれを説明と例で裏付けます。
本論の各段落は4–5文、つまり60〜80語程度にします。第1段落の内容を言葉を変えて繰り返さないでください。
本論の第2段落の残りを書いてください。
本論の段落2を展開する
60
結論でエッセイを締めくくります。要点を2文でまとめ、その後に、このテーマがなぜ重要かについて1〜2文を加えましょう。
序論をそのまま写したり、新しい論点を加えたりしないでください。結論全体は35〜50語に収めます。
結論を3–4文で書いてください。
結論を書く
35
序論、トピックセンテンス、本論の段落、結論が、1つのエッセイとしてまとまりました。1つの文章として読み、設問のすべての要素に答えているか確認しましょう。
自分の表現をエッセイの解答例と比べ、各段落がそれぞれ別の役割を果たしていることに注目しましょう。
エッセイを見直してから、「次へ」をクリックして進んでください。
完成したエッセイを見直す
決め方
タスク2のエッセイでは、設問のすべての部分に答えます。課題の達成度は、設問が求めていることをカバーし、主なポイントをそれぞれ説明と例で裏付けているかで決まります。
決まった順番で進めましょう。序論、2つのトピックセンテンス、展開した2つの本論の段落、そして結論です。
- 序論を書く.
ふつう、この段落には2つの文が必要です。自分の言葉と同義語を使って設問を言い換えましょう。こうすることでエッセイがテーマから外れず、幅広い語彙を示すこともできます。2文目では、本論の段落で論じる具体的なトピックを紹介します。したがって、序論には次の内容を入れましょう:
- 言い換えた設問
- 具体的なトピックの紹介
- トピックセンテンスを2つ書く. 本論の各段落に、トピックセンテンスを1つずつ書きましょう。
- 本論の段落を展開する. 本論の各段落を2つのポイントで裏付け、それぞれのポイントに説明と例を加えましょう。本論の各段落は4〜5文程度にします。
- 結論を書く. 主なポイントをまとめ、そのテーマがなぜ重要かを述べましょう。
- 完成したエッセイを見直す. 各部分を通して読み、設問のすべての部分に答えているかを確認しましょう。
展開した2つの段落は、展開していない4つのポイントより高く評価されます。試験官は裏付けを評価するので、ポイントを増やすのではなく、すでにあるポイントに説明と例を加えましょう。
序論
ふつう、この段落には2つの文が必要です。自分の言葉と同義語を使って設問を言い換えましょう。こうすることでエッセイがテーマから外れず、幅広い語彙を示すこともできます。2文目では、本論の段落で論じる具体的なトピックを紹介します。したがって、序論には次の内容を入れましょう:
- 言い換えた設問
- 具体的なトピックの紹介
トピックセンテンス
本論の各段落に、トピックセンテンスを1つずつ書きましょう。それぞれの文で、その段落の要点を12〜20語で導入し、例は次の段階にとっておきます。
裏付け
トピックセンテンスは、裏付けがあって初めて得点になります。そのポイントがなぜ正しいのかを説明し、具体的な例を挙げ、2つの本論の段落に同じくらいの裏付けを入れましょう。本論の各段落は4〜5文程度にします。
結論
結論では、主なポイントを2文でまとめ、そのテーマがなぜ重要かを1〜2文で加えます。序論を書き写したり、新しい論点を加えたりしないでください。
問題と解決策
このタイプの質問では、問題または状況が与えられます。あなたの仕事は、その状況の原因と 問題のいくつかの解決策を説明することです。質問は一般的な解決策を求めるかもしれません(例:この問題はどのように解決できますか) あるいは特定のグループがどのように問題を解決できるかを尋ねるかもしれません(例:政府と個人は問題に対処するためにどのような措置を講じることができますか?)。 影響を詳細に言及する必要はなく、簡潔に述べるだけで十分です。
More and more wild animals are on the verge of extinction and others are on the endangered list. What are the reasons for this? What can be done to solve this problem?
- Write at least 250 words.
- You should spend around 40 minutes on this task.
The number of critically endangered animals is growing significantly, while a disturbing number of other species have become threatened. This worrying trend stems from several causes, though solutions exist where the will to implement them is present.
Regarding species on the critically endangered list, outmoded beliefs in Eastern medicine that endangered animal parts have medicinal qualities is driving demand for them, particularly in China. Animals are needlessly killed to cure ailments from infertility to arthritis, and China’s increasing affluence mean demand is expected to increase even further. Despite this, limited action by governments has proven ineffective at stopping such a trade. Many species threatened with extinction live in national parks, typically in developing countries. However, chronic underfunding means officials there are powerless to catch poachers, and corruption means the ones who are caught, often get away.
Where political will is available, several solutions may help. To begin with, developed countries could help fund budgets to protect endangered species in poorer countries. While this doesn’t solve the issue of corruption, it would increase deterrence and hopefully reduce the number of animals needlessly killed. More meaningfully, in countries where animal parts are bought and sold, laws should be more strictly enforced and punishments massively increased to discourage both sellers and buyers alike. A concerted education campaign should also be effected to stamp out the perception that animal parts have any curative properties to reduce the market for such ‘goods’ once and for all.
In conclusion, removing the market for animal parts, and better protecting the endangered animals that remain may help preserve the world’s natural heritage before it is too late.
Further reasons to consider:
Development destroying their habitat and food sourceGrowing cities and farmland encroach on habitatMany animals cannot find the place to raise their youngFurther solutions to consider:
Increase government budgets to protect animalsFor example, the panda is now rebounding in Southern China due to concerted government efforts to protect it.Task Achievement — Task 2
Learn how to answer this question in a step-by-step interactive exercise
Task Achievement — Task 2
IELTS ライティングのタスク2では、設問のすべての要素に答えるエッセイを書きます。主張文と指示文を注意深く読み、設問が何について論じるよう求めているかに注目しましょう。
テーマからは外れていなくても、実際に問われたことに答えていないエッセイは、高いバンドスコアには届きません。
問題を確認したら、「次へ」をクリックして進んでください。
設問を確認する
序論を2文、合計25〜35語程度で書きましょう。まず、設問を自分の言葉で書き直します。自分の言葉や同義語を使って設問を言い換えましょう。そうすることでエッセイがテーマから外れず、幅広い語彙力も示せます。2文目では、本論の段落で論じる具体的なトピックを紹介します。
序論を書いてください。
序論を書く
本論の各段落には、その要点を示すトピックセンテンスが必要です。この長さのエッセイなら、本論の段落は2つで十分です。
各段落について、はっきりした文を1つずつ書きましょう。各文は12〜20語に収め、説明や例は次のステップに残しておきます。
本論の各段落のトピックセンテンスを1つずつ書いてください。
トピックセンテンスを2つ書く
animals are killed for traditional medicine
more funding, stricter laws and education
トピックセンテンスは、裏付けがあって初めて得点になります。本論の第1段落を2つのポイントで展開しましょう。それぞれのポイントについて、説明と具体的な例を書きます。
本論の各段落は4–5文、つまり60〜80語程度にします。一般的な記述よりも、具体的な状況を挙げたほうが説得力があります。
本論の第1段落の残りを書いてください。
本論の段落1を展開する
60
本論の第2段落も、第1段落と同じくらい掘り下げて書きましょう。2つのポイントを挙げ、それぞれを説明と例で裏付けます。
本論の各段落は4–5文、つまり60〜80語程度にします。第1段落の内容を言葉を変えて繰り返さないでください。
本論の第2段落の残りを書いてください。
本論の段落2を展開する
60
結論でエッセイを締めくくります。要点を2文でまとめ、その後に、このテーマがなぜ重要かについて1〜2文を加えましょう。
序論をそのまま写したり、新しい論点を加えたりしないでください。結論全体は35〜50語に収めます。
結論を3–4文で書いてください。
結論を書く
35
序論、トピックセンテンス、本論の段落、結論が、1つのエッセイとしてまとまりました。1つの文章として読み、設問のすべての要素に答えているか確認しましょう。
自分の表現をエッセイの解答例と比べ、各段落がそれぞれ別の役割を果たしていることに注目しましょう。
エッセイを見直してから、「次へ」をクリックして進んでください。
完成したエッセイを見直す
決め方
タスク2のエッセイでは、設問のすべての部分に答えます。課題の達成度は、設問が求めていることをカバーし、主なポイントをそれぞれ説明と例で裏付けているかで決まります。
決まった順番で進めましょう。序論、2つのトピックセンテンス、展開した2つの本論の段落、そして結論です。
- 序論を書く.
ふつう、この段落には2つの文が必要です。自分の言葉と同義語を使って設問を言い換えましょう。こうすることでエッセイがテーマから外れず、幅広い語彙を示すこともできます。2文目では、本論の段落で論じる具体的なトピックを紹介します。したがって、序論には次の内容を入れましょう:
- 言い換えた設問
- 具体的なトピックの紹介
- トピックセンテンスを2つ書く. 本論の各段落に、トピックセンテンスを1つずつ書きましょう。
- 本論の段落を展開する. 本論の各段落を2つのポイントで裏付け、それぞれのポイントに説明と例を加えましょう。本論の各段落は4〜5文程度にします。
- 結論を書く. 主なポイントをまとめ、そのテーマがなぜ重要かを述べましょう。
- 完成したエッセイを見直す. 各部分を通して読み、設問のすべての部分に答えているかを確認しましょう。
展開した2つの段落は、展開していない4つのポイントより高く評価されます。試験官は裏付けを評価するので、ポイントを増やすのではなく、すでにあるポイントに説明と例を加えましょう。
序論
ふつう、この段落には2つの文が必要です。自分の言葉と同義語を使って設問を言い換えましょう。こうすることでエッセイがテーマから外れず、幅広い語彙を示すこともできます。2文目では、本論の段落で論じる具体的なトピックを紹介します。したがって、序論には次の内容を入れましょう:
- 言い換えた設問
- 具体的なトピックの紹介
トピックセンテンス
本論の各段落に、トピックセンテンスを1つずつ書きましょう。それぞれの文で、その段落の要点を12〜20語で導入し、例は次の段階にとっておきます。
裏付け
トピックセンテンスは、裏付けがあって初めて得点になります。そのポイントがなぜ正しいのかを説明し、具体的な例を挙げ、2つの本論の段落に同じくらいの裏付けを入れましょう。本論の各段落は4〜5文程度にします。
結論
結論では、主なポイントを2文でまとめ、そのテーマがなぜ重要かを1〜2文で加えます。序論を書き写したり、新しい論点を加えたりしないでください。
2部構成の質問
このタイプの質問では、2つの質問が与えられ、両方の質問に答える必要があります。 2つの質問は異なります。例えば、アイデアや行動の重要性を評価する必要があるかもしれません (例:それはどれほど重要ですか?)、そして同意するか反対するかを述べる必要があります(例:同意しますか、反対しますか?)。
News editors decide what to broadcast on television and what to print in newspapers. What factors do you think influence these decisions? Do you think that there is too much emphasis on bad news these days?
- Write at least 250 words.
- You should spend around 40 minutes on this task.
In the news business, editors have the final say in what makes it to air, or what makes it to print in newspapers. There are a variety of factors that affect their decision making; however, in my opinion, the public is inundated with negative news content, and more positive news would be beneficial to all.
Regarding news stories worth focusing on, editors must weigh up a number of aspects. For one thing, timing is a major factor in choosing stories to inform the public, especially ones that affect many people. Stories that happen right away are classified as newsworthy, however, if the same story happens again, it’s no longer interesting. For another, proximity to a story is important. Stories that happen closer to home become more newsworthy than those far away, so domestic news stories become more noteworthy than international ones. Finally, human interest stories always garner attention since they don’t date quickly, and often offer an emotion connection with the audience.
However, to my mind most news shared with the public is of a negative slant. Through TV, print and online media, society is inundated with stories of crime, disasters, and war to the point that the good news becomes exceptional. As a result, people have become accustomed to this trend and become more anxious about the state of the world. For this reason, I believe having a greater proportion of positive news in the media would benefit everyone. Stories of human interest, scientific discovery or human achievement help everyone understand the world around them, and make better decisions. That way, society can better understand the world rather than simply view it as a dangerous place.
In conclusion, although news editors face a lot of challenges in choosing newsworthy stories, I believe a more optimistic approach would add further value to the news profession.
Task Achievement — Task 2
Learn how to answer this question in a step-by-step interactive exercise
Task Achievement — Task 2
IELTS ライティングのタスク2では、設問のすべての要素に答えるエッセイを書きます。主張文と指示文を注意深く読み、設問が何について論じるよう求めているかに注目しましょう。
テーマからは外れていなくても、実際に問われたことに答えていないエッセイは、高いバンドスコアには届きません。
問題を確認したら、「次へ」をクリックして進んでください。
設問を確認する
序論を2文、合計25〜35語程度で書きましょう。まず、設問を自分の言葉で書き直します。自分の言葉や同義語を使って設問を言い換えましょう。そうすることでエッセイがテーマから外れず、幅広い語彙力も示せます。2文目では、本論の段落で論じる具体的なトピックを紹介します。
序論を書いてください。
序論を書く
本論の各段落には、その要点を示すトピックセンテンスが必要です。この長さのエッセイなら、本論の段落は2つで十分です。
各段落について、はっきりした文を1つずつ書きましょう。各文は12〜20語に収め、説明や例は次のステップに残しておきます。
本論の各段落のトピックセンテンスを1つずつ書いてください。
トピックセンテンスを2つ書く
timing, distance and human interest
too much bad news makes people anxious
トピックセンテンスは、裏付けがあって初めて得点になります。本論の第1段落を2つのポイントで展開しましょう。それぞれのポイントについて、説明と具体的な例を書きます。
本論の各段落は4–5文、つまり60〜80語程度にします。一般的な記述よりも、具体的な状況を挙げたほうが説得力があります。
本論の第1段落の残りを書いてください。
本論の段落1を展開する
60
本論の第2段落も、第1段落と同じくらい掘り下げて書きましょう。2つのポイントを挙げ、それぞれを説明と例で裏付けます。
本論の各段落は4–5文、つまり60〜80語程度にします。第1段落の内容を言葉を変えて繰り返さないでください。
本論の第2段落の残りを書いてください。
本論の段落2を展開する
60
結論でエッセイを締めくくります。要点を2文でまとめ、その後に、このテーマがなぜ重要かについて1〜2文を加えましょう。
序論をそのまま写したり、新しい論点を加えたりしないでください。結論全体は35〜50語に収めます。
結論を3–4文で書いてください。
結論を書く
35
序論、トピックセンテンス、本論の段落、結論が、1つのエッセイとしてまとまりました。1つの文章として読み、設問のすべての要素に答えているか確認しましょう。
自分の表現をエッセイの解答例と比べ、各段落がそれぞれ別の役割を果たしていることに注目しましょう。
エッセイを見直してから、「次へ」をクリックして進んでください。
完成したエッセイを見直す
決め方
タスク2のエッセイでは、設問のすべての部分に答えます。課題の達成度は、設問が求めていることをカバーし、主なポイントをそれぞれ説明と例で裏付けているかで決まります。
決まった順番で進めましょう。序論、2つのトピックセンテンス、展開した2つの本論の段落、そして結論です。
- 序論を書く.
ふつう、この段落には2つの文が必要です。自分の言葉と同義語を使って設問を言い換えましょう。こうすることでエッセイがテーマから外れず、幅広い語彙を示すこともできます。2文目では、本論の段落で論じる具体的なトピックを紹介します。したがって、序論には次の内容を入れましょう:
- 言い換えた設問
- 具体的なトピックの紹介
- トピックセンテンスを2つ書く. 本論の各段落に、トピックセンテンスを1つずつ書きましょう。
- 本論の段落を展開する. 本論の各段落を2つのポイントで裏付け、それぞれのポイントに説明と例を加えましょう。本論の各段落は4〜5文程度にします。
- 結論を書く. 主なポイントをまとめ、そのテーマがなぜ重要かを述べましょう。
- 完成したエッセイを見直す. 各部分を通して読み、設問のすべての部分に答えているかを確認しましょう。
展開した2つの段落は、展開していない4つのポイントより高く評価されます。試験官は裏付けを評価するので、ポイントを増やすのではなく、すでにあるポイントに説明と例を加えましょう。
序論
ふつう、この段落には2つの文が必要です。自分の言葉と同義語を使って設問を言い換えましょう。こうすることでエッセイがテーマから外れず、幅広い語彙を示すこともできます。2文目では、本論の段落で論じる具体的なトピックを紹介します。したがって、序論には次の内容を入れましょう:
- 言い換えた設問
- 具体的なトピックの紹介
トピックセンテンス
本論の各段落に、トピックセンテンスを1つずつ書きましょう。それぞれの文で、その段落の要点を12〜20語で導入し、例は次の段階にとっておきます。
裏付け
トピックセンテンスは、裏付けがあって初めて得点になります。そのポイントがなぜ正しいのかを説明し、具体的な例を挙げ、2つの本論の段落に同じくらいの裏付けを入れましょう。本論の各段落は4〜5文程度にします。
結論
結論では、主なポイントを2文でまとめ、そのテーマがなぜ重要かを1〜2文で加えます。序論を書き写したり、新しい論点を加えたりしないでください。
意見
このタイプの質問では、意見を含む質問が与えられます。 あなたの仕事は、その意見に応じてエッセイを書くことです。このタイプの質問は、しばしば意見に同意するか反対するかを尋ねます。
Some people are concerned that children spend too much time on computers – playing games, chatting and watching videos. But all this time is actually good preparation for children, who will have to spend many hours working on computers throughout their education and their working lives.To what extent do you agree or disagree with this statement?
- Write at least 250 words.
- You should spend around 40 minutes on this task.
With all the time that children spend engaged in various activities on computers, some people believe this is good preparation for a future in which many will work on computers full time through school and at work. I completely oppose this belief for several reasons.
To begin with, time on computers learning computer skills cannot be equated with that spent playing games or chatting online. While there may be some truth that videos games increase problem solving and analytical skills, there is no evidence to suggest that they improve other workplace skills. The skills children really need in a future work place are coding, designing, and software skills to name a few. The only way to ensure they learn these is for adults to be on hand to teach and supervise such learning.
Furthermore, spending too much time online may further have negative consequences to a child’s mental health. Unsupervised time on computers can result in children encountering inappropriate content online. Children have an extremely short attention span so are easily distracted by what they see or encounter online. There’s also the very real risk that children become addicted to the video games they play. Video game addiction is a proven disorder and affects many children in the US today. The quick-reward based system of such games is attractive and negatively affects how children learn and are motivated.
In conclusion, unless a child wishes to be a video game designer, increased computer time not only has little value to them beyond entertainment, it may even negatively affect a child’s development in the long term. Children should be supervised by adults when using computers to ensure they learn what they’re supposed to.
Task Achievement — Task 2
Learn how to answer this question in a step-by-step interactive exercise
Task Achievement — Task 2
IELTS ライティングのタスク2では、設問のすべての要素に答えるエッセイを書きます。主張文と指示文を注意深く読み、設問が何について論じるよう求めているかに注目しましょう。
テーマからは外れていなくても、実際に問われたことに答えていないエッセイは、高いバンドスコアには届きません。
問題を確認したら、「次へ」をクリックして進んでください。
設問を確認する
序論を2文、合計25〜35語程度で書きましょう。まず、設問を自分の言葉で書き直します。自分の言葉や同義語を使って設問を言い換えましょう。そうすることでエッセイがテーマから外れず、幅広い語彙力も示せます。2文目では、本論の段落で論じる具体的なトピックを紹介します。
序論を書いてください。
序論を書く
本論の各段落には、その要点を示すトピックセンテンスが必要です。この長さのエッセイなら、本論の段落は2つで十分です。
各段落について、はっきりした文を1つずつ書きましょう。各文は12〜20語に収め、説明や例は次のステップに残しておきます。
本論の各段落のトピックセンテンスを1つずつ書いてください。
トピックセンテンスを2つ書く
games do not teach work skills
too much screen time harms children
トピックセンテンスは、裏付けがあって初めて得点になります。本論の第1段落を2つのポイントで展開しましょう。それぞれのポイントについて、説明と具体的な例を書きます。
本論の各段落は4–5文、つまり60〜80語程度にします。一般的な記述よりも、具体的な状況を挙げたほうが説得力があります。
本論の第1段落の残りを書いてください。
本論の段落1を展開する
60
本論の第2段落も、第1段落と同じくらい掘り下げて書きましょう。2つのポイントを挙げ、それぞれを説明と例で裏付けます。
本論の各段落は4–5文、つまり60〜80語程度にします。第1段落の内容を言葉を変えて繰り返さないでください。
本論の第2段落の残りを書いてください。
本論の段落2を展開する
60
結論でエッセイを締めくくります。要点を2文でまとめ、その後に、このテーマがなぜ重要かについて1〜2文を加えましょう。
序論をそのまま写したり、新しい論点を加えたりしないでください。結論全体は35〜50語に収めます。
結論を3–4文で書いてください。
結論を書く
35
序論、トピックセンテンス、本論の段落、結論が、1つのエッセイとしてまとまりました。1つの文章として読み、設問のすべての要素に答えているか確認しましょう。
自分の表現をエッセイの解答例と比べ、各段落がそれぞれ別の役割を果たしていることに注目しましょう。
エッセイを見直してから、「次へ」をクリックして進んでください。
完成したエッセイを見直す
決め方
タスク2のエッセイでは、設問のすべての部分に答えます。課題の達成度は、設問が求めていることをカバーし、主なポイントをそれぞれ説明と例で裏付けているかで決まります。
決まった順番で進めましょう。序論、2つのトピックセンテンス、展開した2つの本論の段落、そして結論です。
- 序論を書く.
ふつう、この段落には2つの文が必要です。自分の言葉と同義語を使って設問を言い換えましょう。こうすることでエッセイがテーマから外れず、幅広い語彙を示すこともできます。2文目では、本論の段落で論じる具体的なトピックを紹介します。したがって、序論には次の内容を入れましょう:
- 言い換えた設問
- 具体的なトピックの紹介
- トピックセンテンスを2つ書く. 本論の各段落に、トピックセンテンスを1つずつ書きましょう。
- 本論の段落を展開する. 本論の各段落を2つのポイントで裏付け、それぞれのポイントに説明と例を加えましょう。本論の各段落は4〜5文程度にします。
- 結論を書く. 主なポイントをまとめ、そのテーマがなぜ重要かを述べましょう。
- 完成したエッセイを見直す. 各部分を通して読み、設問のすべての部分に答えているかを確認しましょう。
展開した2つの段落は、展開していない4つのポイントより高く評価されます。試験官は裏付けを評価するので、ポイントを増やすのではなく、すでにあるポイントに説明と例を加えましょう。
序論
ふつう、この段落には2つの文が必要です。自分の言葉と同義語を使って設問を言い換えましょう。こうすることでエッセイがテーマから外れず、幅広い語彙を示すこともできます。2文目では、本論の段落で論じる具体的なトピックを紹介します。したがって、序論には次の内容を入れましょう:
- 言い換えた設問
- 具体的なトピックの紹介
トピックセンテンス
本論の各段落に、トピックセンテンスを1つずつ書きましょう。それぞれの文で、その段落の要点を12〜20語で導入し、例は次の段階にとっておきます。
裏付け
トピックセンテンスは、裏付けがあって初めて得点になります。そのポイントがなぜ正しいのかを説明し、具体的な例を挙げ、2つの本論の段落に同じくらいの裏付けを入れましょう。本論の各段落は4〜5文程度にします。
結論
結論では、主なポイントを2文でまとめ、そのテーマがなぜ重要かを1〜2文で加えます。序論を書き写したり、新しい論点を加えたりしないでください。
IELTSライティングTask 2のためのIELTSライティングサンプルと戦略
一般的に、IELTSライティングTask 2に取り組むには4つのステップがあります。
1. 読んで理解する - このステップは自明に思えるかもしれませんが、多くの受験者は緊張に押されて、目の前の質問を完全に理解できません。 これがライティングTask 2で最初に必要なのは、質問を完全に理解し、キーワードに下線を引くことである理由です。 さらに、以下の2つのことを考えてください。
- どのタイプのエッセイを書く必要がありますか?(例えば、問題と解決策になる可能性があります)。
- このトピックにどの程度精通していますか?(この質問は、使用するアウトラインに影響を与える可能性があるため重要です。
2. アウトラインを計画する - 質問が何を尋ねているのか、また書く必要のあるエッセイのタイプを理解したので、アウトラインを描く準備ができました。 このステップをスキップしないでください。これにかかる時間はわずか 2〜3分で、これからの参照として役立ちます。 また、質問の尋ね方によって、アウトラインは異なります。各エッセイタイプの質問を分析し、アウトラインを計画する方法を学ぶには、 IELTSライティングTask 2レッスンをご覧ください。
3. アウトラインのメモを作成する - アウトラインを選択して下書きしたので、各段落の主な文のキーワードを使ってアウトラインにメモを取ります。 これにより、エッセイを"マッピングアウト"し、それがどのようになるかの俯瞰図が得られます。この段階では、各段落の主なトピックを既に理解できているはずです。4. ライティングを始める - アウトラインを計画した後、導入から書き始め、そこから続けていきます。 フォーマルな調子を使うことを忘れないでください(短縮形を使わない、10未満の数字を書き出すなど)、各段落の後にインデントしてください。
以下のブログ投稿は、各質問タイプに取り組む方法を教え、100以上のIELTSライティングTask 2の問題とサンプルエッセイを含んでいます。IELTSの準備に自由にご利用ください。